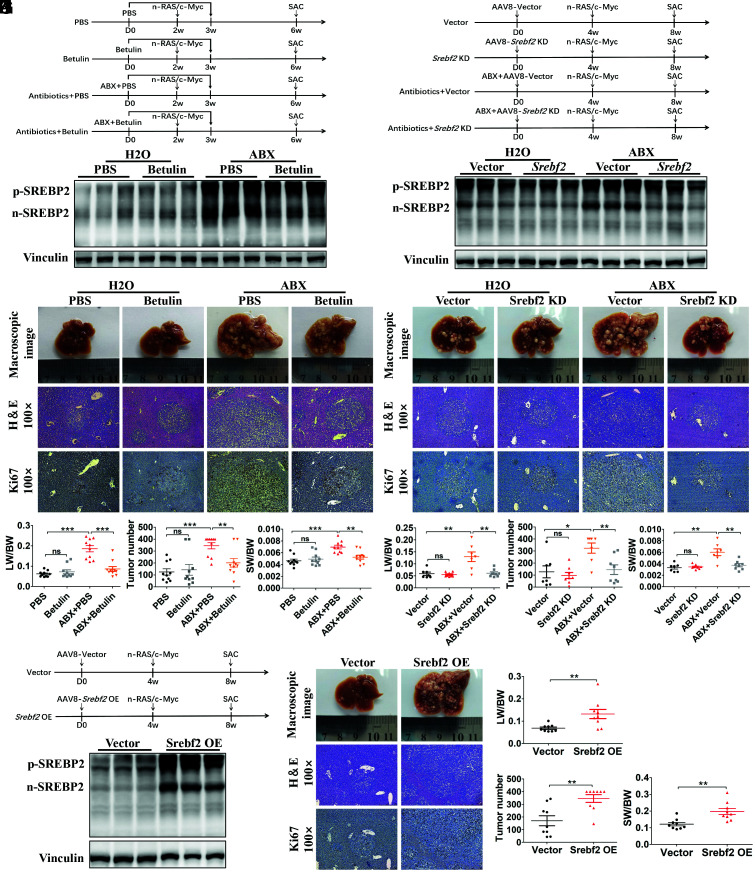
Fig. 4.
Elevated liver SREBP2 promoted tumorigenesis in mice with gut commensal bacteria depletion. (A) Experimental procedure of betulin administration. (B) Western blotting of liver SREBP2 from mice in each group before HTVi (n = 3 per group). (C) Representative macroscopic views of livers, H&E staining, and IHC of Ki67 in mouse HCCs. (D) The LW/BW ratio, tumor number, and the SW/BW ratio of each group (n = 10 per group). (E) Experimental procedure of AAV8-mediated Srebf2 knockdown. (F) The AAV8-Srebf2 KD-mediated knockdown of liver SREBP2 was analyzed using Western blotting before HTVi (n = 3 per group). (G) Representative macroscopic views of livers, H&E staining, and IHC of Ki67 in mouse HCCs. (H) The LW/BW ratio, tumor number, and the SW/BW ratio of AAV8-vector or AAV8-Srebf2 KD-transfected mice fed with ABX or H2O (Vector, n = 7; Srebf2 KD, n = 8; ABX+Vector, n = 7; ABX+Srebf2 KD, n = 8). (I) Mice were transfected with AAV8-vector or AAV8-Srebf2 OE, and HTVi (Ras/Myc) was performed 4 wk after AAV transfection. (J) The AAV-mediated overexpression of liver SREBP2 was analyzed using Western blotting before HTVi (n = 3 per group). (K) Mice transfected with the AAV8-vector or AAV8-Srebf2 OE were killed 4 wk after HTVi, shown are representative macroscopic views of the livers, H&E staining, and IHC of Ki67 in mouse HCCs. (L) The LW/BW ratio, tumor number, and the SW/BW ratio of AAV8-vector or AAV8-Srebf2 OE mice (n = 9 per group). Data were presented as mean ± SEM, P values were calculated by Student’s t test. ns, not significant; **P <0.01; ***P <0.001.

