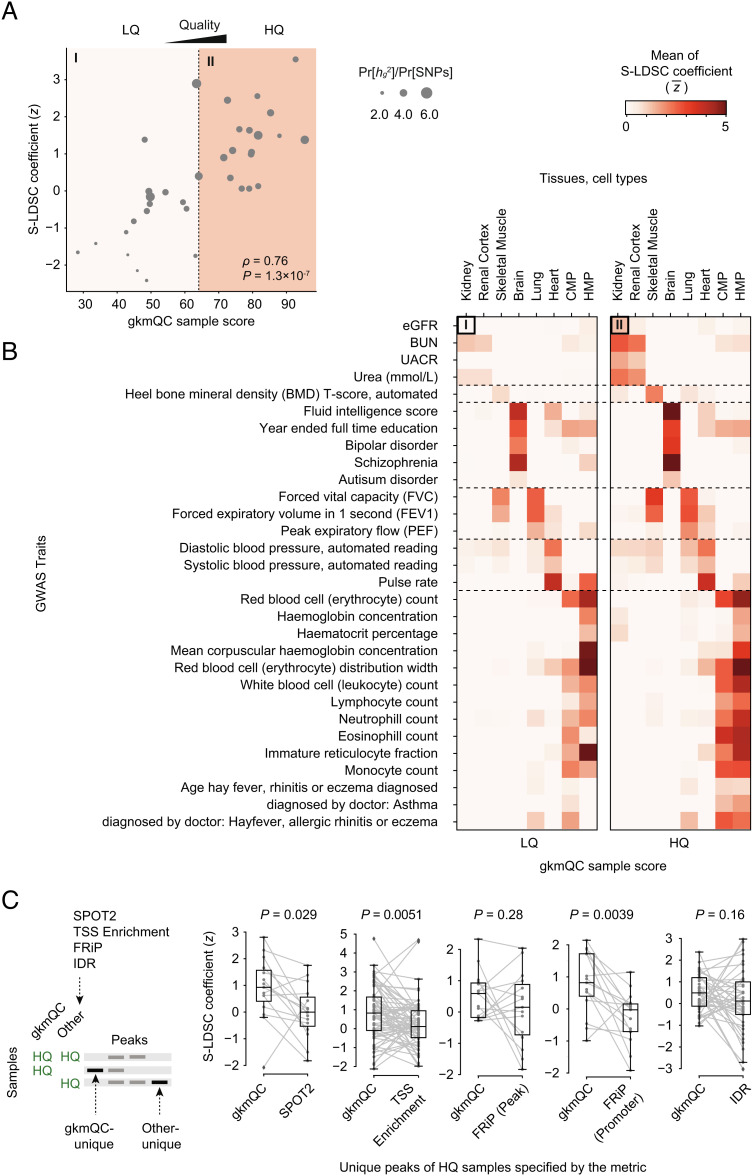
Fig. 4.
Peaks in HQ samples exhibit greater heritability for relevant phenotypes. (A) A scatterplot comparing the gkmQC score and normalized S-LDSC coefficient (z score) for eGFR is shown for 35 developing kidney samples. The S-LDSC coefficient directly correlates with the enrichment score of heritability for eGFR. (B) Two heatmaps comparing the average S-LDSC coefficients between high- and low-quality samples. We used the top 50% gkmQC scores as a threshold for sample quality classification. The top-left cells of the two heatmaps summarize the scatterplot of (A). CMP and HMP are the abbreviations of common myeloid progenitor and hematopoietic multipotent myeloid progenitor cells, respectively. (C) The comparison of S-LDSC coefficients for peaks uniquely identified in gkmQC-HQ samples and HQ samples specific for another QC method. A schematic diagram shows how the unique peaks were defined for the joint S-LDSC analysis. P values were calculated from the Mann–Whitney U test.

