Fig. 6.
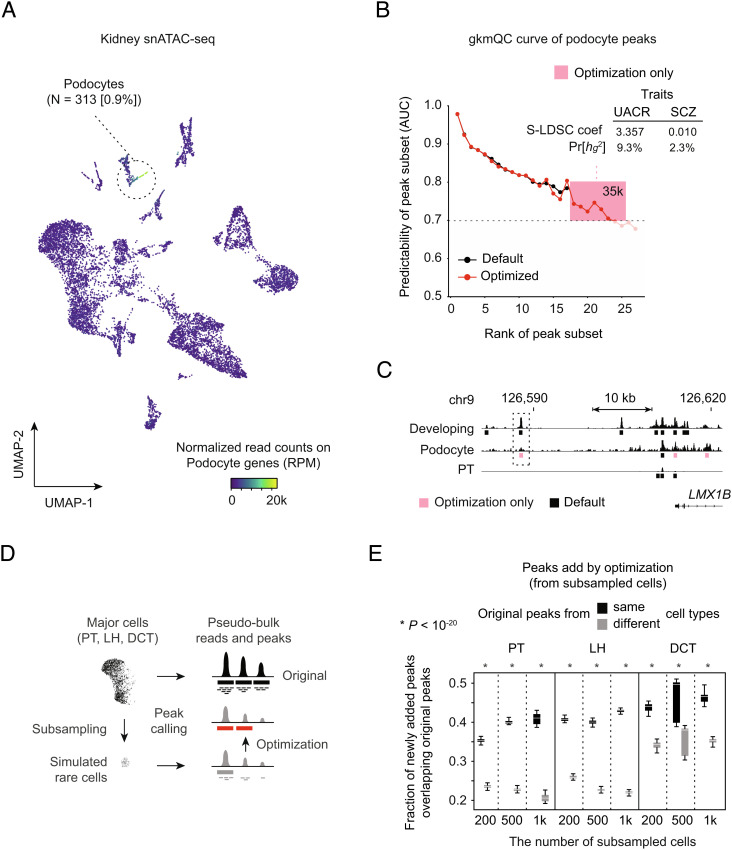
Improvement of peak calling in snATAC-seq data for rare cell types. (A) A UMAP plot of kidney snATAC-seq analysis. The heatmap colors represent open-chromatin activities of podocyte-specific genes. (B) gkmQC curves for pseudobulk reads of podocyte cells are shown before and after optimization. Peak subsets within the pink box are the ones newly discovered by optimization. The Inset table shows a heritability analysis result for the podocyte-relevant (UACR) trait and one nonrelevant (schizophrenia, SCZ) trait for these newly identified peaks only. (C) A specific example of podocyte open-chromatin peaks in the LMX1B locus. The pink bar is a newly called peak by optimization. PT is the proximal tubule, the most abundant cell type in the kidney, and is used as a control to show cell-type specificity of the new peaks. (D) A schematic describing how gkmQC optimization is assessed using random subsampling of major cell types to simulate rare cell types. (E) Box plots represent fractions of optimized peaks in subsampled cells overlapping the original peaks. LH and DCT are the abbreviations of loop of Henle and distal convolute tubule cells, respectively (SI Appendix, Fig. S9A).

