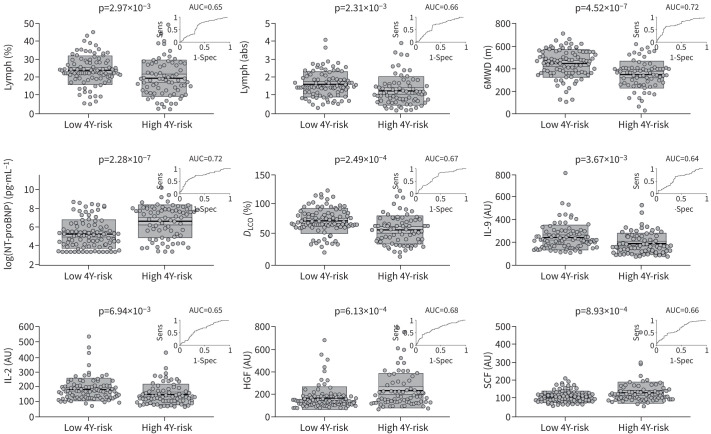
FIGURE 2.
Mean comparison between low 4-year risk group and high 4-year risk group for each of the nine markers chosen through recursive feature elimination. Each plot shows raw data, mean, 95% CI (light shading), 1sd (dark shading). An inset in each plot shows the receiver operating curve for that marker along with the area under the curve (AUC). Lymph: lymphocytes; sens: sensitivity; spec: specificity; high 4Y-risk: high 4-year risk of death or need for transplant; low 4Y-risk: low 4-year risk of death; abs: absolute; 6MWD: 6-min walk distance; NT-proBNP: N-terminal pro-brain natriuretic peptide; DLCO: diffusing capacity of the lung for carbon monoxide; IL: interleukin; AU: arbitrary units; HGF: hepatocyte growth factor; SCF: stem cell factor.

