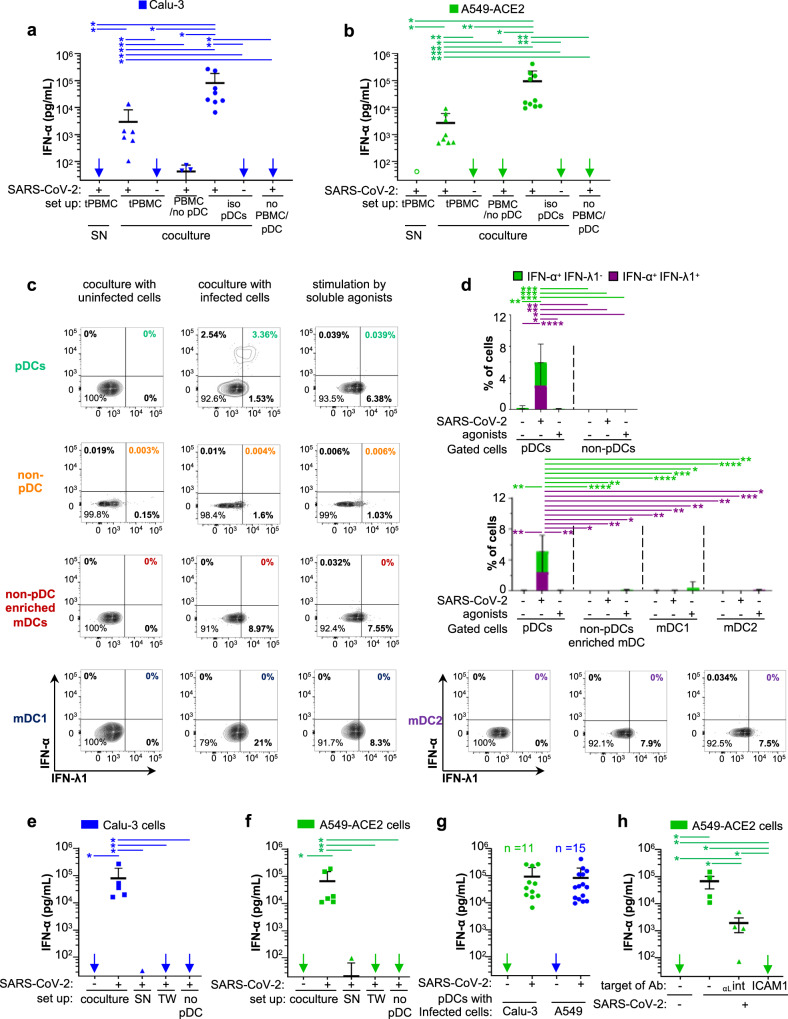
Fig. 1. pDCs are the main IFN-α producers in response to contact with SARS-CoV-2-infected cells.
Cells were infected by SARS-CoV-2 (indicated as +) or not (indicated as −) 2 days prior to coculture with PBMCs, pDC-depleted PBMCs, and isolated pDCs (16 h-coculture). Infected cell types included the human alveolar basal epithelial cell lines, i.e., Calu-3 and A549-ACE2. Statistical analyses of the results were performed using Wilcoxon rank-sum test and p values were calculated with Tukey and Kramer test. For the different panels, the significant contrasts are indicated when p-values are: ≤0.05 as *; ≤0.005 as **; ≤0.0005 as ***; and ≤0.00005 as ****. a, b Quantification of IFN-α in the supernatants of total PBMCs [tPBMC], pDC-depleted PBMCs [PBMC/no pDC], and isolated pDCs [iso pDC] cocultured with either SARS-CoV-2-infected or uninfected Calu-3 cells (a) or A549-ACE2 cells (b), or treated with 100 µl of cell-free supernatant (SN) collected from SARS-CoV-2-infected cells. Of note, viral titers of SARS-CoV-2: SN ≈ 2.5 × 10⁵ foci forming units (ffu)/ml, MOI ≈ 1 per pDCs and no detection of IFN-α by SARS-CoV-2-infected cells themselves [no PBMC/pDC]. Arrows indicate results below the detection threshold of the IFN-α ELISA (i.e., 12.5 pg/ml). Each dot represents one independent experiment performed with distinct healthy donors (ELISA results are similarly presented in all other Figures). Error bars represent the means ± standard deviation (SD); from independent experiments (n = 5, 8, and 9 for the conditions of cocultures, respectively, with PBMCs, pDCs/Calu-3 cells, and pDCs/A549-ACE2 cells); exact p-values are indicated to Supplementary Fig. 8. c, d Total PBMCs were cocultured with SARS-CoV-2-infected or uninfected A549-ACE2 cells or treated with TLR agonists [31.8 µM R848 and 42.22 µM polyI:C] for 14–16 h. Cell populations gated as pDCs, non-pDC PBMCs, non-pDC enriched mDCs, mDC1, and mDC2 subsets, see gating strategies in Supplementary Fig. 1a. Representative dot blots of flow cytometry analyses (c) and frequencies of cells (d) positive for IFN-α+ but IFN-λ1− or double positive for IFN-α+/IFN-λ1+ in gated pDCs versus non-pDC PBMCs (upper panels) and in gated pDCs versus non-pDC enriched mDCs, mDC1 and mDC2 subsets (lower panels). Means ± SD; Bars represent n = 10–11 independent experiments/distinct healthy donors. e–h Quantification of IFN-α in SNs of pDCs cocultured with the indicated cell types infected or not by SARS-CoV-2. e, f pDCs were cocultured with infected cells, either in direct contact [coculture] or physically separated by the semi-permeable membrane of transwell [TW], or treated with SN from the corresponding SARS-CoV-2-infected cells. IFN-α concentration was also determined in the SN of SARS-CoV-2-infected cells cultured without pDC (no pDC). Means ± SD; n = 5 independent experiments for pDC cocultured with infected cells or SN and n = 4 for TW and no pDC. g Dots represent IFN levels for pDCs purified from distinct donors in independent experiments; including n = 11 and n = 15 for A549-ACE2 and Calu-3 cells, respectively. Means ± SD. h Quantification of IFN-α in SNs of pDCs cocultured with SARS-CoV-2-infected cells A549-ACE2 treated or not with blocking antibodies against αL-integrin and ICAM-1 at 10 µg/mL; means ± SD; each dots represent n = 4 independent experiments. Source data are provided as a Source Data file.

