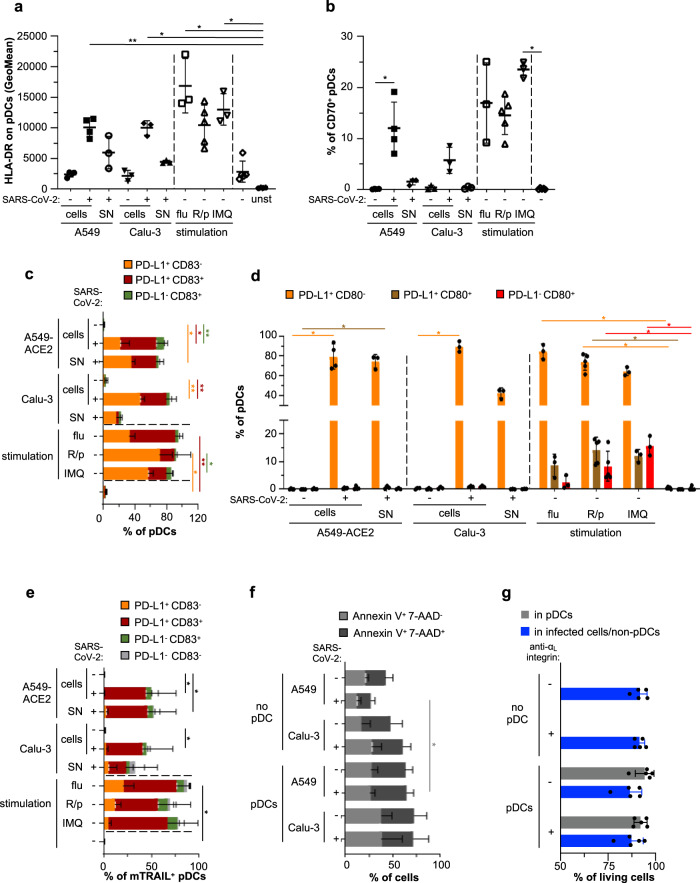
Fig. 3. SARS-CoV-2-infected cells induce pDC maturation and phenotypic diversification.
Human pDCs isolated from healthy donors were cocultured with SARS-CoV-2-infected [+] or uninfected [−] A549-ACE2 or Calu-3 cells (indicated as [cells]), or were stimulated with 100 µl of cell-free supernatants [SN] collected immediately prior coculture from the corresponding SARS-CoV-2-infected cells (viral titers ≈2.5 × 10⁵ ffu/ml - MOI ≈ 1/pDCs), or were stimulated with influenza virus [flu] (viral titers ≈ 107 pfu/ml - MOI ≈ 0.5/pDCs), R848/polyI:C [R/p] or imiquimod [IMQ] for 14–16 h, [unst]; unstained. a–e, Quantification by flow cytometry of HLA-DR Geomean (a) or the frequency of pDCs positive for CD70 (b), PD-L1 and/or CD83 (c), PD-L1 and/or CD80 (d), PD-L1 and/or CD83 among mTRAIL+ pDCs (e) determined in gated pDCs (live cells+ singulets+ CD123+ BDCA-2+, see the gating strategy in Supplementary Fig. 3a). f SARS-CoV-2-infected [+] or uninfected [-] A549-ACE2 or Calu-3 cells were cultured alone [no pDC] or cocultured with pDCs for 14–16 h. Quantification by flow cytometry of the frequency of gated A549-ACE2 and Calu-3 cells positive for Annexin V and/or 7-AAD. g icSARS-CoV-2-mNG-infected A549-ACE2 were cultured alone [no pDC] or cocultured with pDCs in the presence or absence of anti-αLintegrin blocking antibody for 48 h. Quantification by flow cytometry of the frequency of living cells using live-dead marker in the gated pDCs (stained with CellTrace Violet prior to coculture) and infected cells/non-pDC. Bars represent means ± SD; Each dot in a, b, d and g, represents one independent experiment using distinct healthy donors; a, b, d, n = 4 independent for pDC cocultured with A549-ACE2 cells and n = 3 with Calu-3 cells as; c, n = 3 for pDCs cocultured with A549-ACE2 cells and n = 4 with Calu-3 cells; e n = 5; f, n = 4; g n = 5. The data were analyzed using Kruskal–Wallis Global test and p values were calculated with Tukey and Kramer test; *≤0.05 and **≤0.005. The exact p values are indicated in Supplementary Fig. 8. Source data are provided as a Source Data file.

