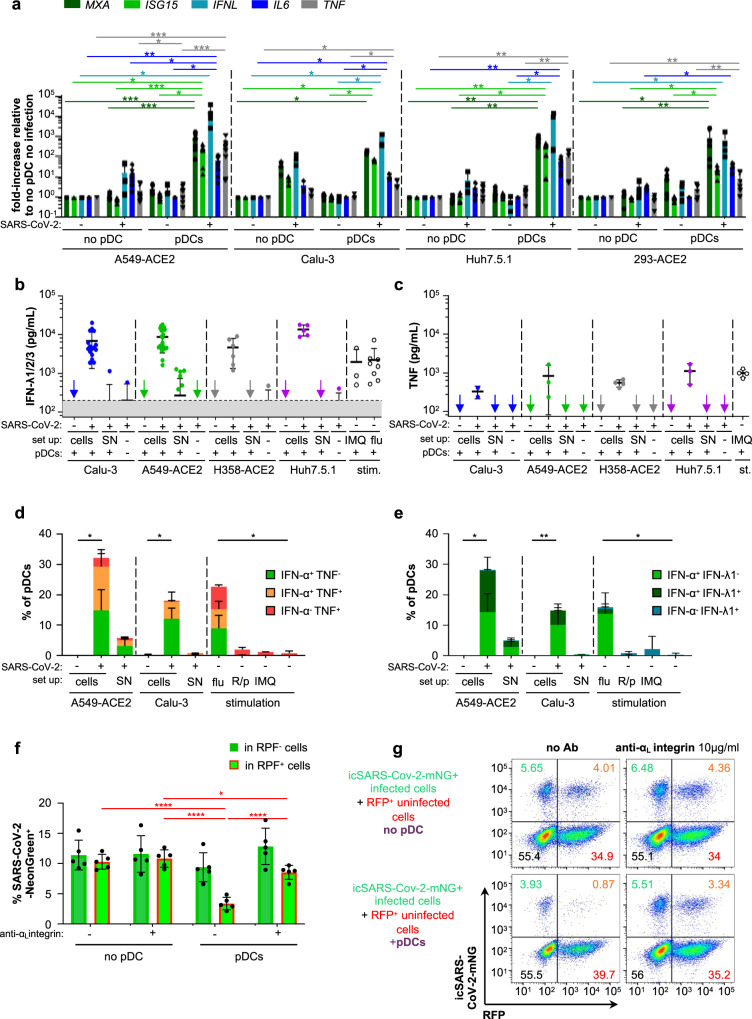
Fig. 4. Cell-cell contact-dependent sensing of SARS-CoV-2-infected cells by pDCs induces a robust production of IFN-I/λ and other cytokines leading to the inhibition of viral spread.
Human pDCs isolated from healthy donors were cocultured with SARS-CoV-2-infected [+] or uninfected [−] cells or were incubated with 100 µl of cell-free supernatant [SN] collected immediately prior to coculture from the corresponding SARS-CoV-2-infected cells, or were stimulated by influenza virus or agonists (as in Figs. 1, 4). For all panels, when appropriated, the p values are indicated as follows: ≤0.05 as *; ≤0.005 as **; ≤0.0005 as ***; and ≤0.00005 as ****. The exact p values are indicated in Supplementary Fig. 8. a Quantification of the induction of ISG (MXA, ISG15), type III IFN (IFNλ1) and pro-inflammatory cytokines (IL-6, TNF) mRNAs in SARS-CoV-2-infected or uninfected A549-ACE2, Calu-3, Huh7.5.1 or 293-ACE2 cells cultured with [pDC] or without pDC [no pDC] by RT-qPCR; means ± SD; n = 8 independent experiments using distinct healthy donors in experiments using A549-ACE2 cells; n = 3 for Calu-3 cells; n = 6 for Huh7.5.1 cells; n = 5 for 293-ACE2; statistical analysis using Kruskal–Wallis Global test; p values as: * ≤0.05, ** ≤0.005 and *** ≤0.0005 (Tukey and Kramer test). b, c Quantification of IFN-λ1/2/3 (b) and TNF (c) in SN of pDCs cocultured with SARS-CoV-2-infected cells [cells] versus [SN], as indicated. Bars represent means ± SD; n = 3–14 (left panel) n = 2–4 (right panel) independent experiments using distinct healthy donors. d, e Quantification by flow cytometry of the frequency of pDCs positive for IFN-α and/or TNF (d) and IFN-α and/or IFN-λ1 (e). Bars represent means ± SD; n = 3–5 independent experiments using distinct healthy donors. f, g A549-ACE2 cells were infected by icSARS-CoV-2-mNG for 24 h and then cocultured with isolated pDCs for 48 h. Cocultured cells were treated or not with anti-αL integrin blocking antibody (10 µg/mL). Viral transmission from icSARS-CoV-2-mNG+ -infected cells to RFP+ uninfected cells in cocultures with pDCs or without pDCs [no pDC] was quantified by flow cytometry (f) and representative dot plots (g). Results are expressed as the percentage of cells positive for mNeonGreen (mNG+) in the RFP+ (orange numbers) and RFP− (green numbers) cell populations. Means ± SD; n = 4–5 independent experiments. Source data are provided as a Source Data file.

