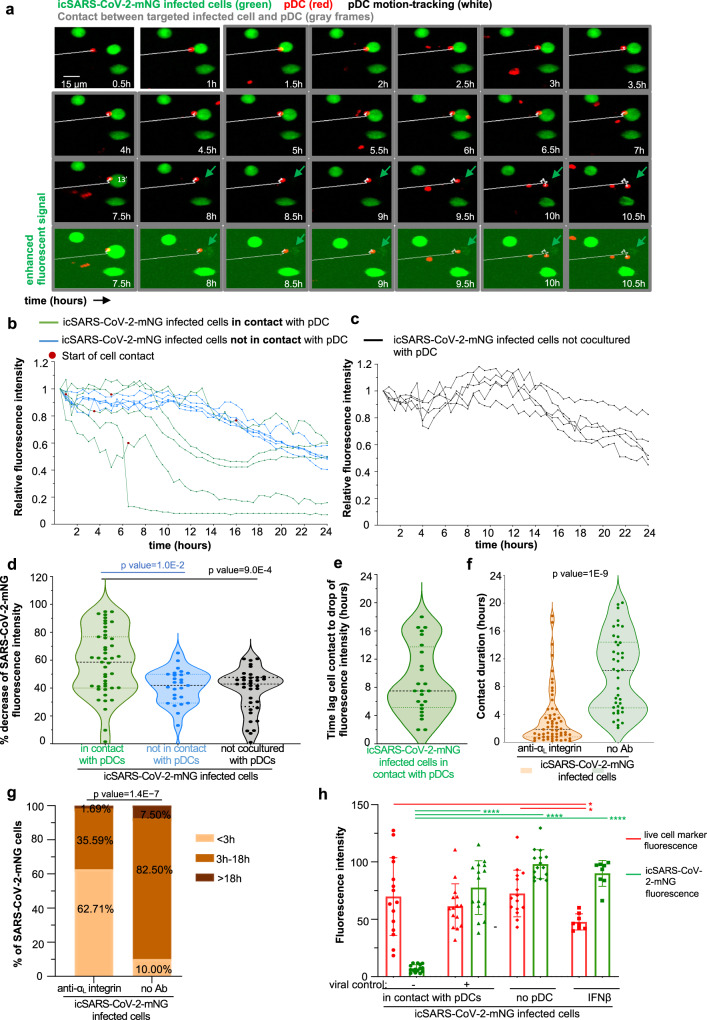
Fig. 5. Targeted antiviral activity of pDCs toward SARS-CoV-2-infected cells.
Live imaging of coculture of icSARS-CoV-2-mNG-infected cells with pDCs by spinning-disk confocal analysis. A549-ACE2 cells were infected by icSARS-CoV-2-mNG for 48 h prior to coculture with pDCs. a Representative time sequence of pDCs (CM-DiI stained, red), tracked using motion automatic tracking plug-in in image J (white line) in contact with icSARS-CoV-2-mNG-infected cells (green arrow). The time points when pDCs are in contact with infected cells are framed in gray. Bottom panels show same imaging of the seven last time points with enhanced fluorescence signal. b–d Calculation of mNeongreen fluorescence intensity over time in individual icSARS-CoV-2-mNG-infected cells cocultured with pDCs and in contact (green) versus cocultured with pDC but not in contact (blue) and, as control/reference, in simultaneously recorded cultures of icSARS-CoV-2-mNG-infected cells in absence of pDC [no pDC, black]. The mNeongreen fluorescence intensity is determined using area-integrated intensity and mean value (quantification tools in Image J). b, c Representative kinetic analysis of mNeongreen fluorescence intensity in individual icSARS-CoV-2-mNG-infected cells cocultured with pDCs (b) in contact or not as indicated versus in absence of pDC (c). The time point corresponding to the onset/start of contact is indicated by a red dot. The results are presented as the mNeongreen fluorescence intensity at the indicated time relative to time 0 of record set to 1; n = 5 individually recorded cells analyzed per condition from one representative experiment (and n = 10–12 in other experiments). d Violin plot representation of the decrease of mNeongreen fluorescence intensity (percentage). Each dot represents one infected cell (n = 118); 4 independent experiments. Statistical analysis was performed using ANOVA (test global) and Tukey multiple comparisons of means. e Violin plot representations of time-lag between the onset of pDC contact and the decrease of mNeongreen fluorescence intensity defined as >50% of the initial fluorescence intensity. Each dot represents one individual icSARS-CoV-2-mNG-infected cells in contact with pDCs, n = 25 from four independent experiments. f, g Live imaging of coculture of icSARS-CoV-2-mNG-infected cells with pDCs treated with blocking antibodies against αL-integrin (10 µg/mL, added 15 min prior and kept during the coculture) versus not treated coculture. The contact duration between icSARS-CoV-2-mNG-infected cells and pDCs was determined for individual contact and presented in violin plot (f) and as categories of contact assigned as short-duration (<3 h) versus long-duration (3–18 h and >18 h) (g). Statistical analyses were performed using Wilcoxon test (f) and Fisher’s test (g). h The icSARS-CoV-2-mNG-infected cells were stained with a fluorescent live cell marker prior to coculture with pDCs and live imaging by spinning-disk confocal analysis. Calculation of the fluorescence intensity of both the live cell marker and mNeongreen over time in individual icSARS-CoV-2-mNG-infected cells cocultured and in contact with pDCs, leading to control of viral replication [+], defined as decrease of fluorescence intensity > 50% relative to the initial mNG fluoresent intensity or not [−]. The simultaneous record of cultures of icSARS-CoV-2-mNG-infected cells in the absence of pDC [no pDC] and treated with recombinant IFNβ (100 UI/mL) served as control/reference. The results are presented as the fluorescence intensity of mNeongreen (green bars) and living cell marker (red bars) relative to the levels in individual icSARS-CoV-2-mNG-infected cells prior to pDC contact and at 30 min-record and set to 100. Each dot represents one individually recorded cells, n = 15 analyzed per condition and means ± SD; n = 2 independent experiments. Statistical analyses were performed using pairwise comparisons using Wilcoxon rank-sum exact test and p values adjustment method: fdr and p values are indicated: ≤0.05 as *; and ≤0.00005 as ****. Source data are provided as a Source Data file.

