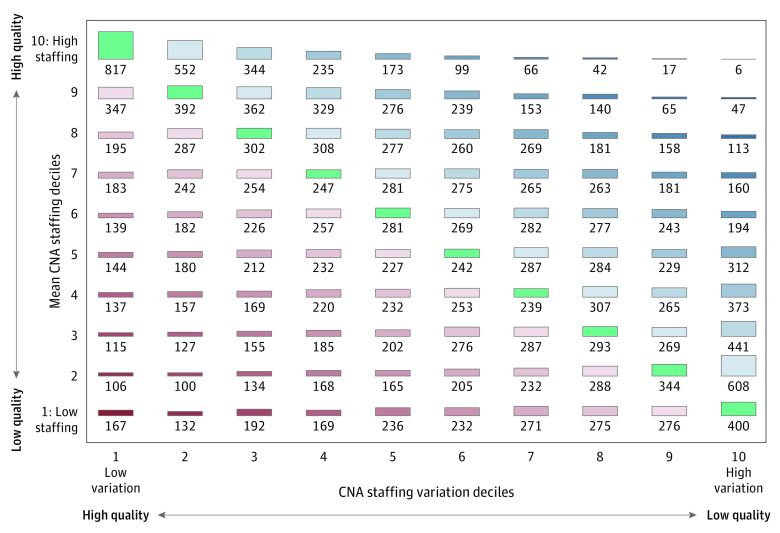
Figure 2. Mean Certified Nurse Aide (CNA) Staffing vs CNA Staffing Daily Variation.
This table presents the number of nursing homes nationally ranked into quality deciles based on (1) mean CNA staffing (y-axis) and (2) daily variation in CNA staffing (x-axis). The numbers on the diagonal are the numbers of nursing homes for which the 2 measures agree on the decile ranking. The cells in blue are those for which mean quality rankings are greater than variability ranking. The cells in red are those for which the variability quality rankings are greater than the mean quality ranking.

