Fig. 3.

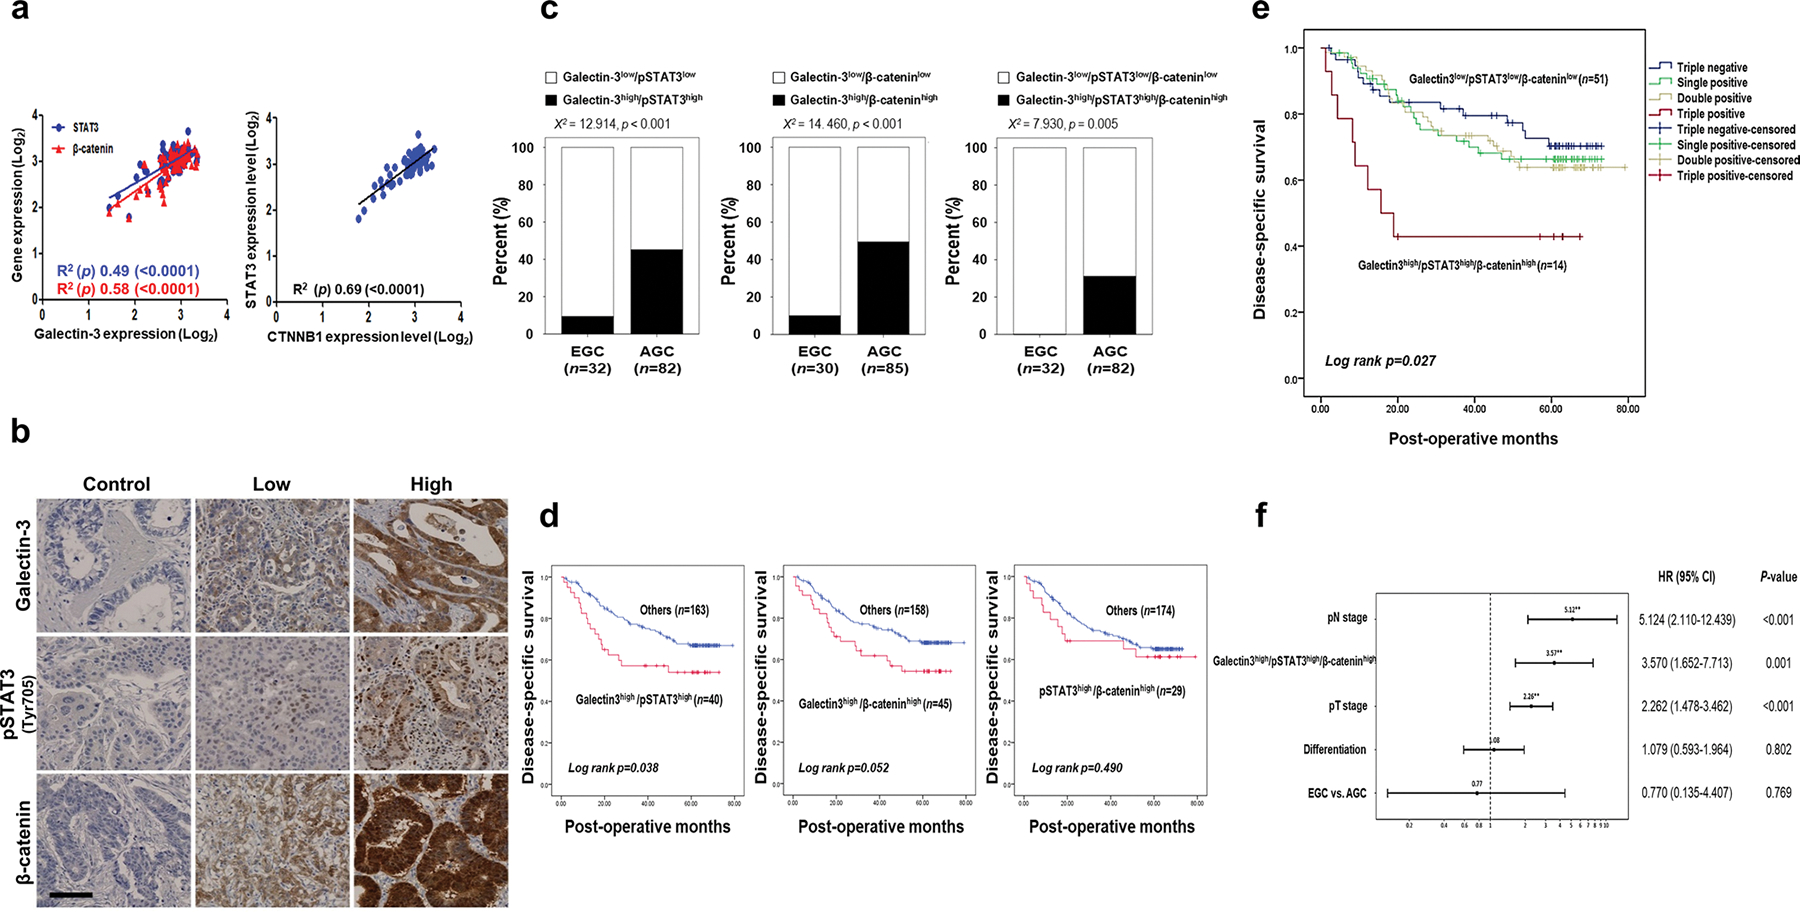
Clinicopathological correlations among galectin-3, β-catenin, and STAT3 in malignant tissues of patients with GC. a Confirmation of the correlations among STAT3, β-catenin, and galectin-3 expression (left) and the correlation between STAT3 and CTNNB1 (β-catenin) expression (right) in the tissues of 80 patients with GC in the GSE27342 public dataset. b Representative IHC analysis of galectin-3, pSTAT3 (Tyr705), and β-catenin expression in 209 GC specimens. Scale bar, 100 μm. c Combinations of galectin-3, pSTAT3(Tyr705), and β-catenin expression were compared between early gastric cancer (EGC) and advanced gastric cancer (AGC). All combined expressions of these three protein were significantly higher in AGC specimens than in EGC specimens (χ2 test; p < 0.001, p < 0.001, and p = 0.005, respectively). d Patients with galectin-3high/pSTAT3high expression had significantly shorter disease-free survival than other patients (mean survival, 38.6 vs. 46.9 months, p = 0.038). Patients with galectin3high/β-cateninhigh expression exhibited a tendency toward worse disease-free survival than patients with others (mean survival, 41.5 vs. 46.7 months, p = 0.052). There was no significant difference in survival between pSTAT3high/β-cateninhigh expression group and others. (e) Patients with galectin-3high/pSTAT3high/β-cateninhigh expression exhibited significantly shorter disease-specific survival (mean survival, 28.8 months) than patients with galectin-3low/pSTAT3low/β-cateninlow expression (mean survival, 47.5 months; Log rank p = 0.008) and others (mean survival, 46.6 months; Log rank p = 0.004). f Multivariate analysis of hazard ratios using the Cox regression method for all patients with gastric cancer. EGC early gastric cancer; AGC advanced gastric cancer
