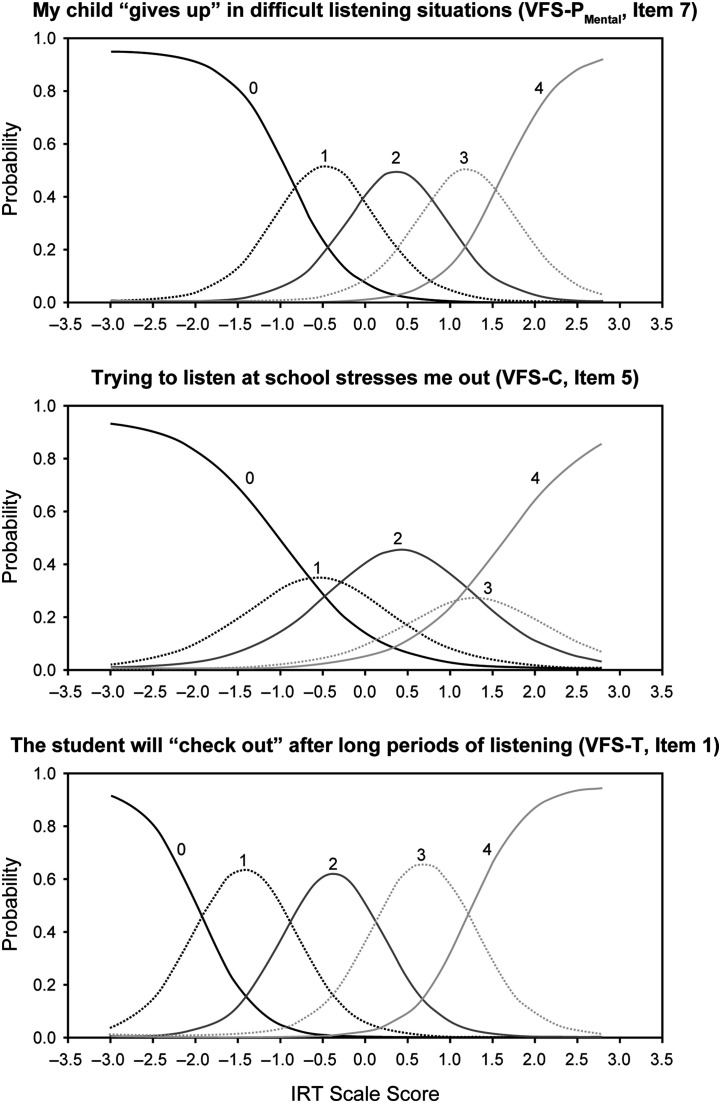
Figure 2.
Exemplar category characteristic curves for representative items from the VFS-Peds. Curves labeled 0, 1, 2, 3, and 4 represent the probability a participant (i.e., a child, parent, or teacher) responds using the option never, rarely, sometimes, often, or almost always, respectively, given the child's underlying magnitude of listening-related fatigue as indicated by the IRT scale score. IRT = item response theory; VFS-C = VFS child self-report scale; VFS-P = VFS parent proxy–report scale; VFS-Peds = pediatric versions of the Vanderbilt Fatigue Scale; VFS-T = VFS teacher proxy–report scale.

 This work is licensed under a