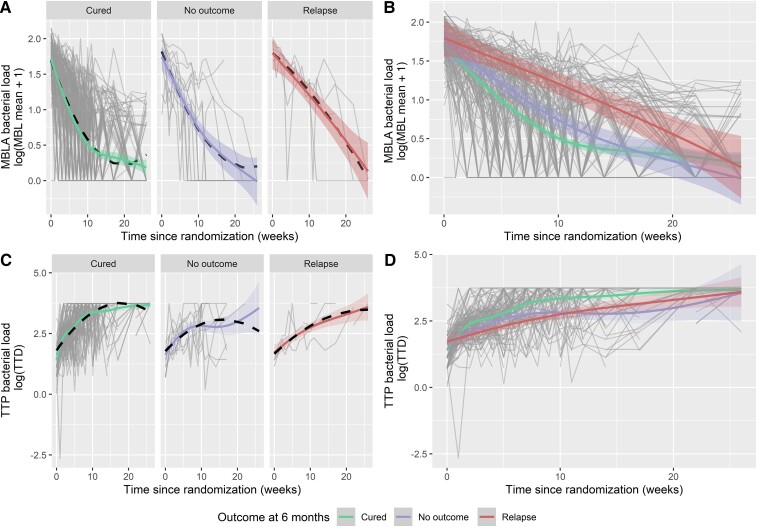
Figure 1.
Quantitative results for bacterial load measured by tuberculosis molecular bacterial load assay over time (A, B), and for mycobacteria growth indicator tube time to positivity (TTP) during treatment (C, D), separated by patient outcome at 12 months postrandomization. Smoothed trend lines for the longitudinal profiles have been described for (log[MBL + 1]) and (log[TTP], days). The black dashed line denotes the regression fit of the marginal component of the linear mixed-effect model, accounting for a linear and quadratic time trend, which is different for the groups cured, relapse, or no outcome in consideration. Abbreviations: MBL, molecular bacterial load; MBLA, molecular bacterial load assay; TTD, time to detection; TTP, time to positivity.

