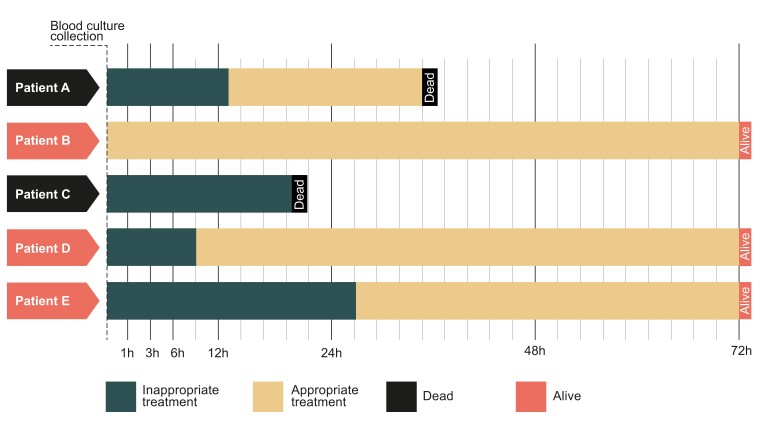
Figure 1.
Schematic figure illustrates the time varying exposure of appropriate treatment. Patients being switched to appropriate treatment at a later time had guaranteed survival to this time point. To avoid immortal time bias, only patients surviving to the landmark time of interest were included in the analysis. At each landmark time, exposure was classified according to the present treatment, irrespectively of if they were later switched to appropriate treatment.

