FIGURE 4.

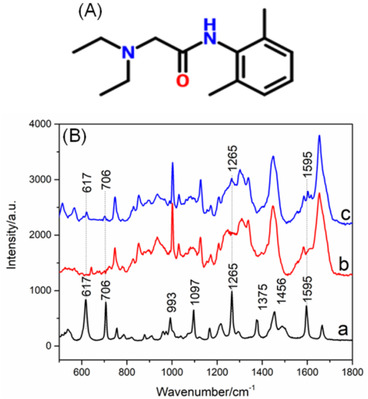
(A) Chemical structure of lidocaine. (B) A typical Raman spectrum of the reference spectrum of pure lidocaine (a), the skin (b), and the skin exposed to 10% lidocaine (c)

(A) Chemical structure of lidocaine. (B) A typical Raman spectrum of the reference spectrum of pure lidocaine (a), the skin (b), and the skin exposed to 10% lidocaine (c)