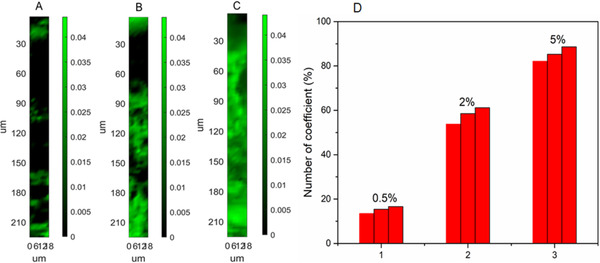
FIGURE 6.

Reconstructed maps of skin samples exposed to different concentration of lidocaine (A) 0.5%, (B) 2%, and (C) 5% following the LSANCR method; the scale bar represents the abundance fraction of lidocaine at different point in preprocessed spectra. (D) Statistical chart of the number of coefficient data for lidocaine with the concentration of 0.5%, 2%, and 5% from three parallel experiments
