
FIGURE 2.
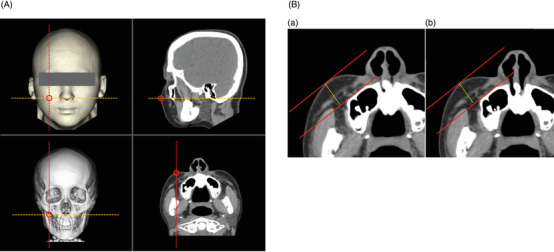
Measurements of the cheek thickness. (A) Reconstructed images on a workstation. On a workstation, the thickest point of the cheek, known as the malar top, was accurately determined using reconstructed sagittal and axial images. The malar top was double‐checked through observations from the anterior side of the face by using a three‐dimensional computed tomography (3DCT) image. On 3DCT images of the face and facial bone, a sagittal image is shown as a red dotted line, and an axial image is shown as an orange dotted line. Spiral CT imaging data have a coordinate axis in the imaging space. Thus, the same point can be precisely indicated on 3DCT images of the face and facial bone, as well as all multiplanar reformatted axial and sagittal images by utilizing the spiral CT coordinates. The centers of the red open circles indicate shared coordinates. (B) Measurements of the cheek thickness both pre‐ and post‐ facial massage. (a) A reconstructed axial image pre‐massage. First, a straight red line was drawn along the surface of the facial bone on a reconstructed axial image of the pre‐facial massage cheek. Next, a red line parallel to it was drawn tangent to the surface of the malar top. The distance from the facial bone to the surface of the malar top was defined as the cheek thickness of the pre‐facial massage. (b) Reconstructed axial image post‐massage. Finally, a reconstructed axial image of the post‐massage cheek at the same level as that used for the pre‐massage evaluation was created using the stationary facial bone as the basis for measurements, and the post‐massage cheek thickness was measured using the same method as that used for the pre‐facial massage measurement. Change rate of the cheek thickness (%) = (cheek thickness post‐massage/cheek thickness pre‐massage) × 100