
FIGURE 4.
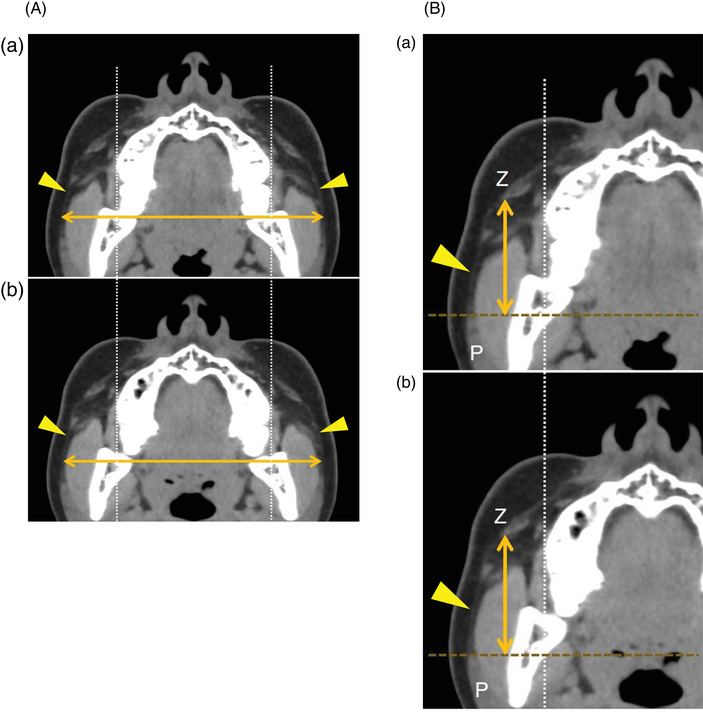
Superficial musculoaponeurotic system (SMAS) measurements. (A) Measurement of SMAS‐width. This computed tomography (CT) scan depicts the SMAS as a subcutaneous linear structure in the adipose tissue (yellow arrowheads). On a reconstructed axial CT image, the widest horizontal distance of the SMAS between the right and left margins of the SMAS was defined as the SMAS‐width. The SMAS‐width pre‐massage was measured. Subsequently, reconstructed axial post‐massage images corresponding to the same level as the pre‐massage image were created using the stationary facial bone as a basis for the measurements. The SMAS‐width post‐massage was then measured. Change rate of the SMAS‐width (%). = (SMAS‐width post‐massage/SMAS‐width pre‐massage) × 100. (B) Measurement of SMAS‐height. On a reconstructed axial CT image, the highest vertical distance of the SMAS (yellow arrowhead) from the anterior edge of the parotid gland (P) to the back of the major zygomatic muscle (Z) was defined as the SMAS‐height. The SMAS‐height pre‐massage was measured, and the SMAS‐height post‐massage was measured on the reconstructed axial image. Change rate of the SMAS‐height (%). = (SMAS‐height post‐massage/SMAS‐height pre‐massage) × 100