
FIGURE 1.
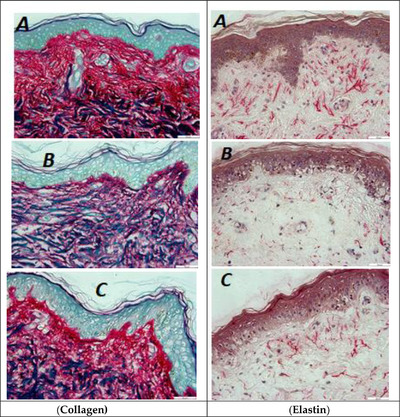
Histochemical imaging of skin sections showing collagen (purple‐red, Left row), elastin (pink‐red, right row). (A) Negative control (untreated): native skin with no treatment to UV or test product, (B) positive control: untreated with test product but treated with UV, and (C) test condition (UV followed by test product. Scale bar = 50 μm. N = 6 × 2 (biopsies × sections)