
FIGURE 2.
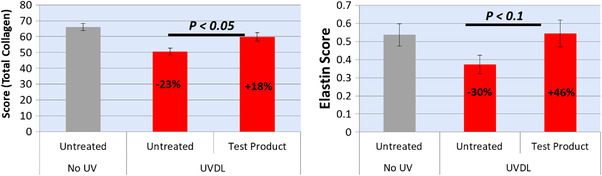
Levels of collagen (left) and elastin (right) quantified from histochemical images to compare negative control (untreated), positive control (treated with UV but not test product), and treated with UV followed by test product. N = 6 × 2 (biopsies × sections)