
FIGURE 3.
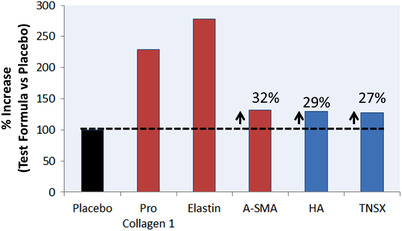
Levels of extracellular matrix (ECM) biomarkers, quantified by ELISA, reported as % increase (test product vs. placebo). Red bars highlight biomarkers with significant differences (P < 0.05) vs. placebo. N = 3 × 2 (biopsies × aliquots). A‐SMA = Alpha‐Smooth Muscle Actin, HA = Hyaluronic Acid, TNSX = Tenascin‐X