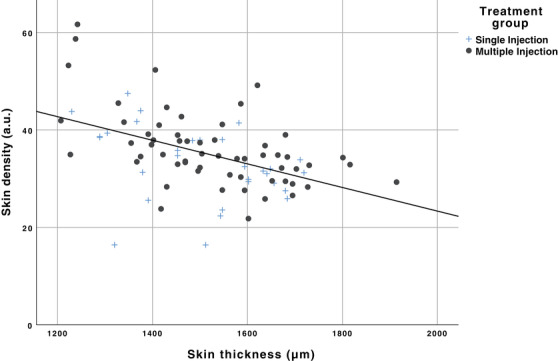
FIGURE 4.

Scatterplot of skin thickness (μm) and skin density (a.u.) shows a moderate significant negative correlation (r s: −0.520, p ≤ 0.001, n = 90) over 6 timepoints for all 15 subjects and for each treatment group over 6 timepoints (single: r s = −0.483, p ≤ 0.007, n = 30, multiple: r s = −0.560, and p ≤ 0.000, n = 60)
