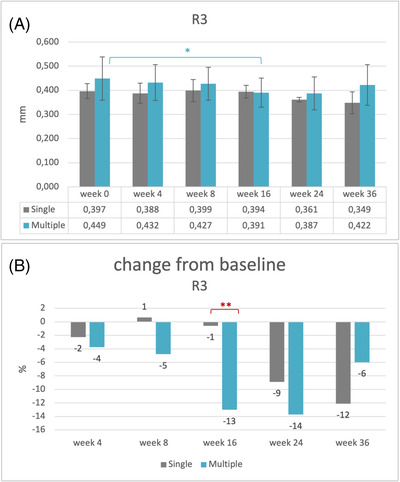
FIGURE 6.

Skin fatigue (R3): (A) mean values and their standard deviations, baseline visit before injection (week 0) and follow‐up visits after injection (weeks 4–36). Statistically significant: *p = 0.019: multiple‐injection values of baseline versus week 16 (n = 15). (B) Change (%) of mean values after injection in comparison with baseline (week 0). Statistically significant: **p = 0.002: multiple‐ versus single‐injection group (n = 15)
