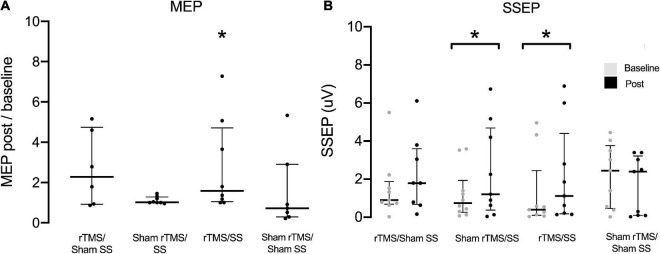
FIGURE 2.
Motor evoked potential (MEP) of lesioned hemisphere before (baseline) and after treatment for each group (A) and Somatosensory evoked potential (SSEP) of paretic upper limbs (B). In (A), MEP data were normalized intraindividually and shown as baseline ratios. μV, Microvolts; SS, peripheral somatosensory stimulation; rTMS, repetitive transcranial magnetic stimulation. Data are presented as median and interquartile range *p < 0.05. Wilcoxon test (baseline Vs. post-treatment).

