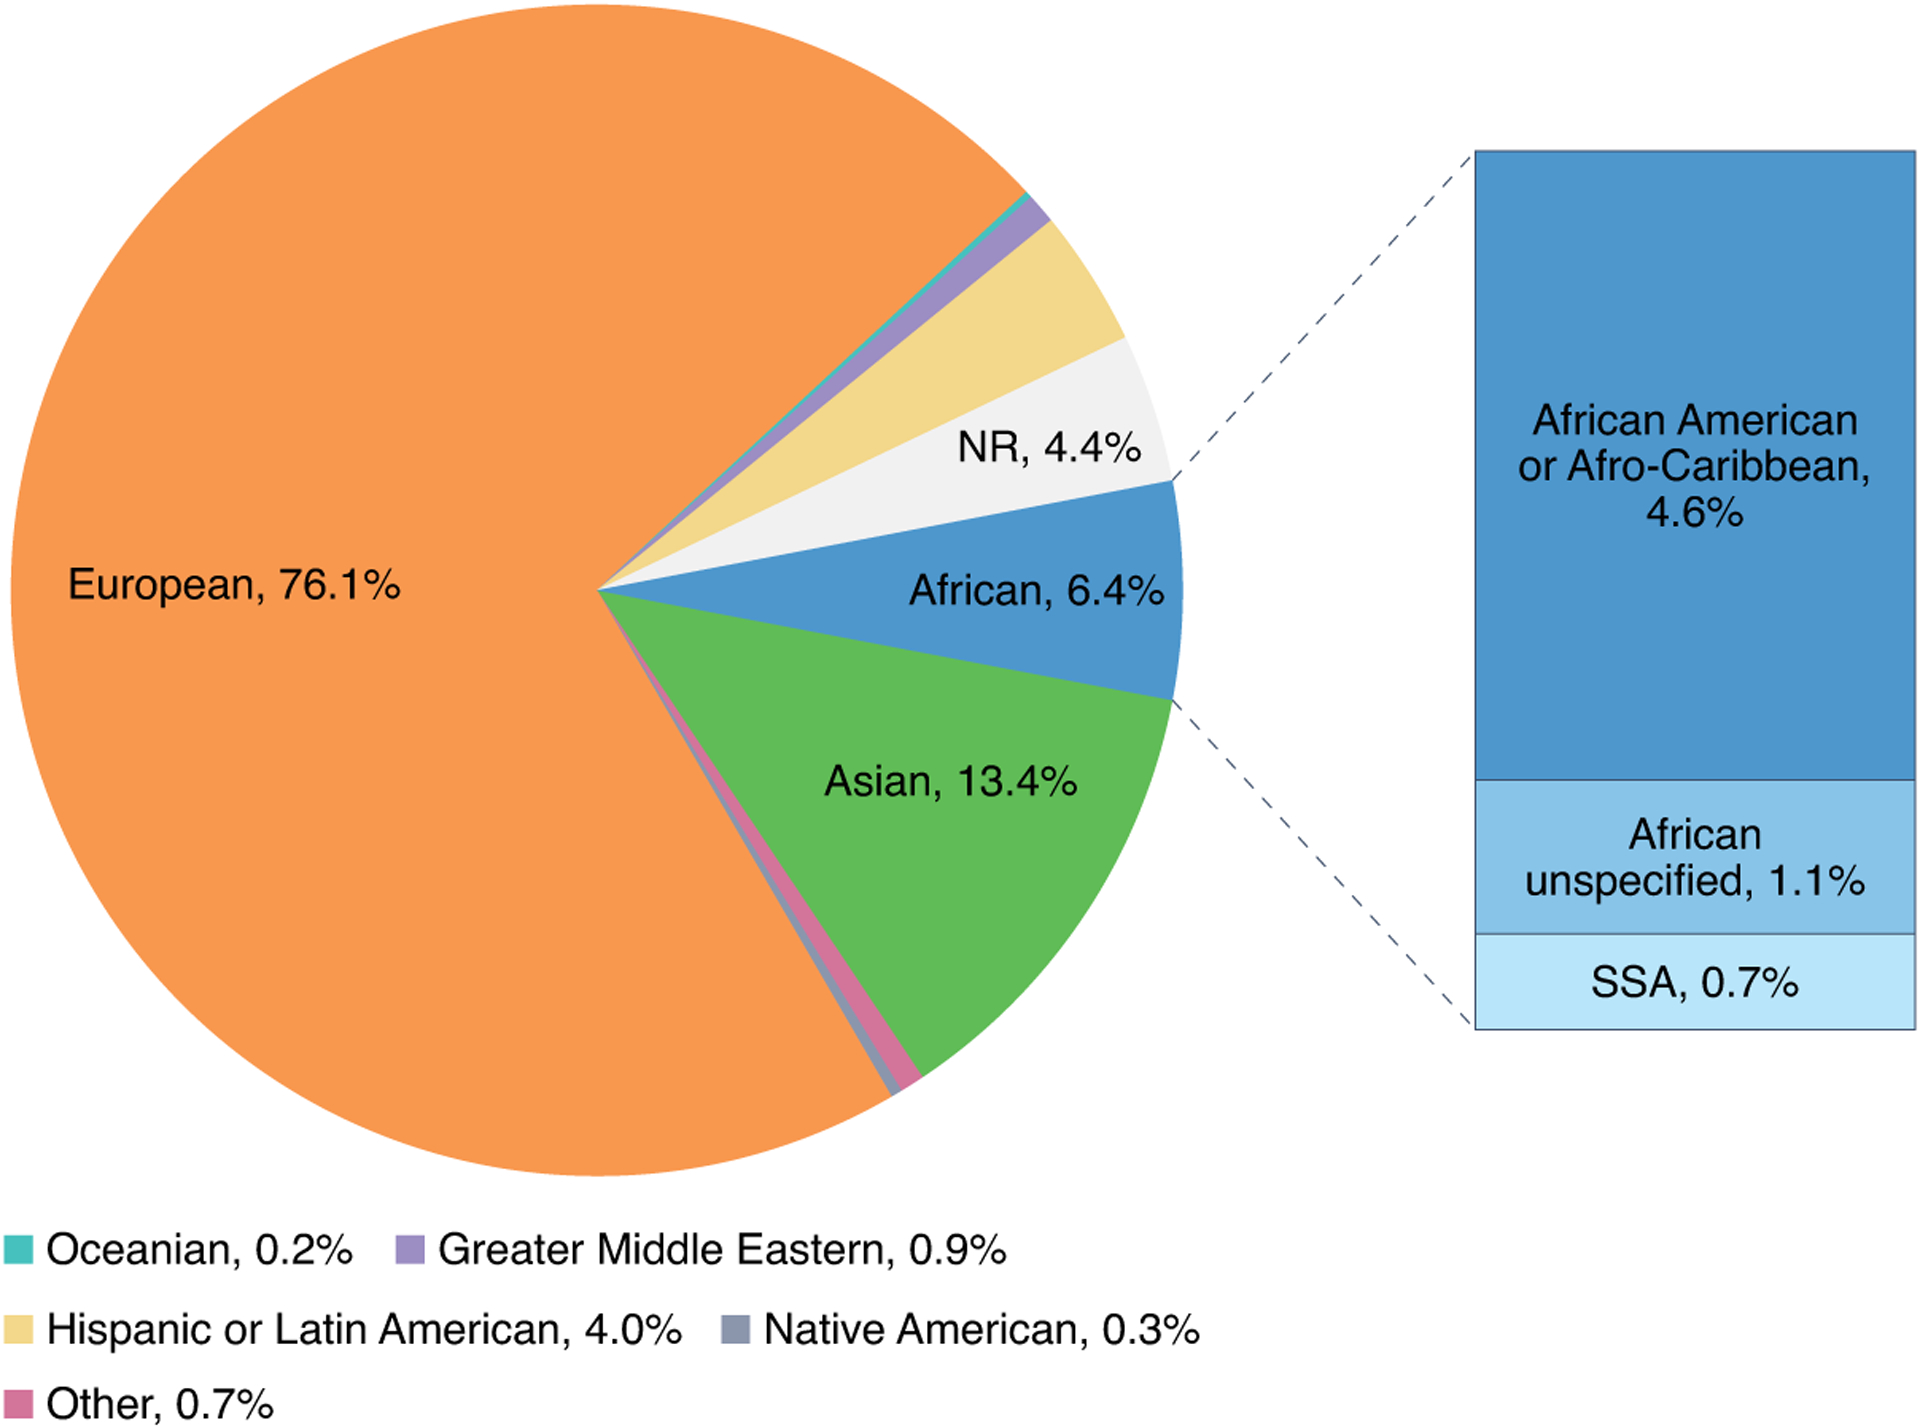
Fig. 1 |. Ancestry distribution in GWAS.

This figure summarizes the distribution of ancestry data contained in the GWAS catalog for studies published from March 2005 to January 2022. It shows the distribution of ancestry categories in percentages, of individuals over time from studies indicating one broad ancestry group. NR, not reported; SSA, sub-Saharan Africa. The figure was created with data obtained from the GWAS catalog.
