


Fig. 2 |. Geographic representation of the core cohorts.
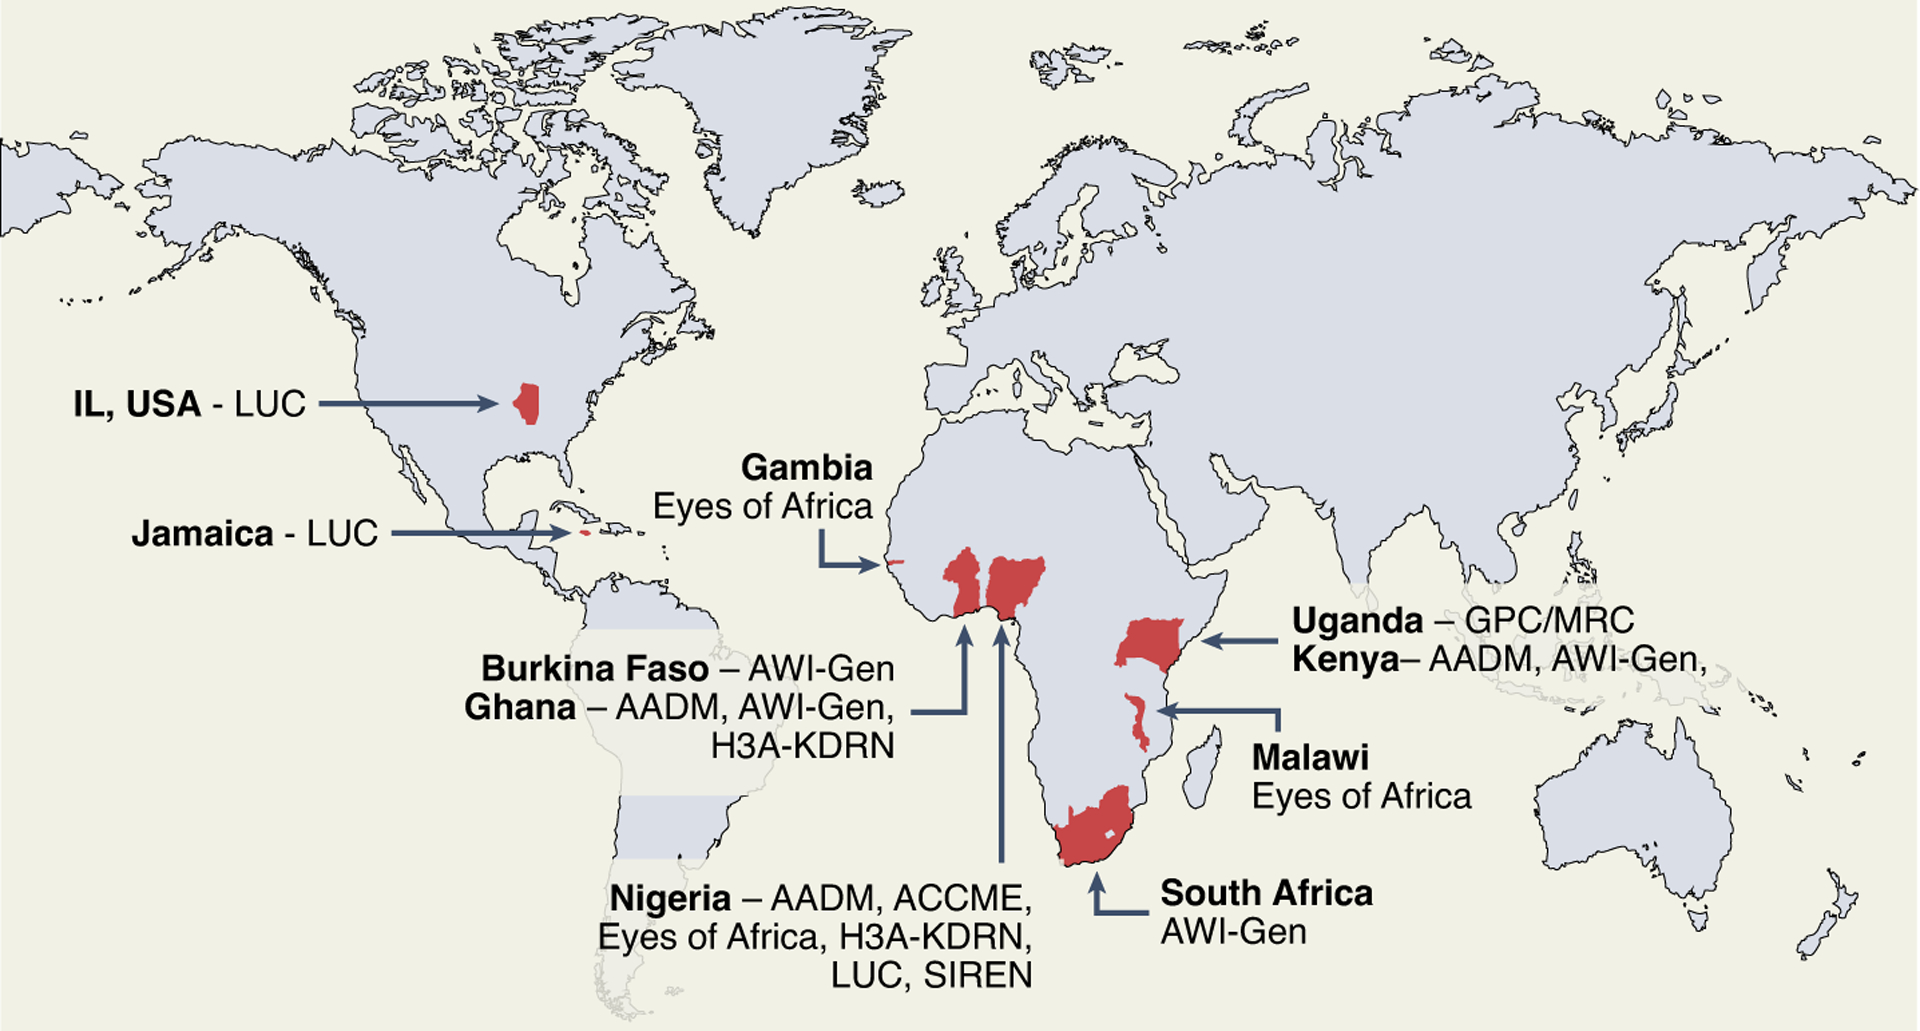
Red indicates the regions where study participants were recruited into the core cohorts in CARDINAL. The figure was created using ArcGIS Pro software by Esri (https://www.esri.com/en-us/arcgis/products/arcgis-pro/overview).