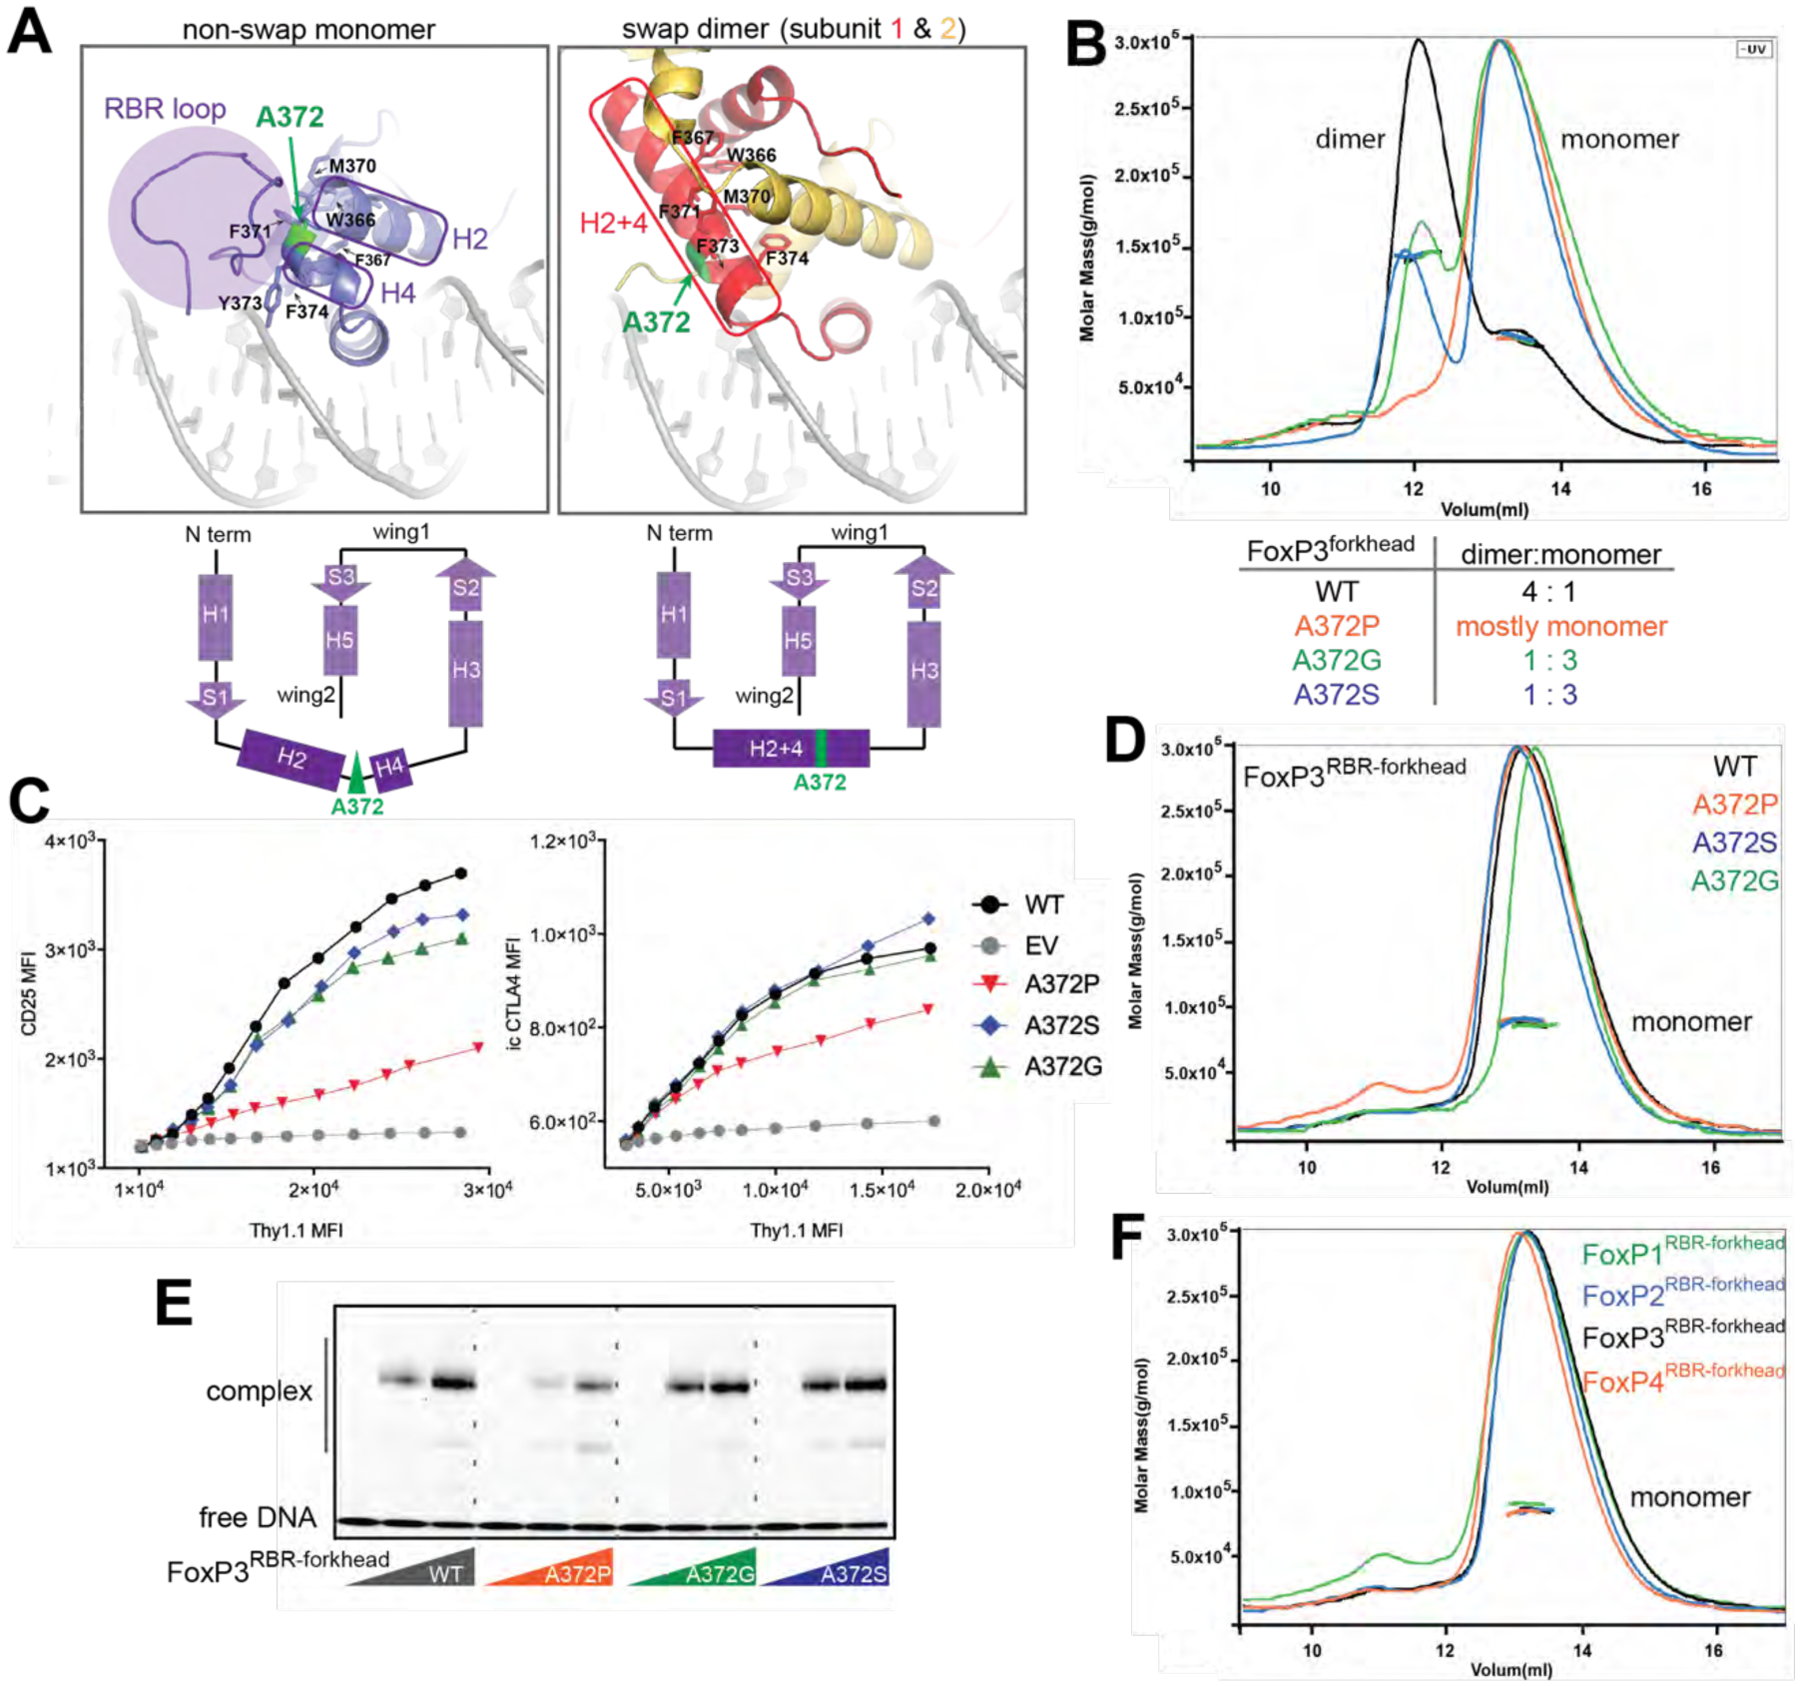
Figure 2. FoxP3 folds into the non-swap monomer in the native domain architecture.

See also Figure S3.
A. Structural comparison between non-swap monomer (our structure) of FoxP3 and swap dimer (previous structure, PDB: 3QRF). Hydrophobic residues (W366, F367, M370, F371, F373 and F374) lining the swap dimerization interface (right) are shown in sticks. Note that these residues in the non-swap monomer are folded to form a hydrophobic core protected by the RBR loop (left). Bottom: the two structures have identical secondary structure topology, except for helix 2 (H2) and helix 4 (H4), which are merged into one helix (H2+4) in the swap dimer. The residue A372 (green) is located in the junction between H2 and H4.
B. SEC-MALS of NusA-tagged FoxP3forkhead with and without mutations in A372. Below: dimer-to-monomer ratio was compared using peak intensities.
C. FoxP3 cellular activity of swap-suppressive mutants, as measured by FACS. CD4+ T cells were retrovirally transduced to express FoxP3 with and without mutations in A372. Transcriptional activity of FoxP3 was analyzed by intracellular (i.c.) staining of CTLA4 or cell surface staining of CD25. FoxP3 expression was measured by Thy 1.1, which is under the control of IRES from the bicistronic mRNA expressing FoxP3.
D. SEC-MALS of NusA-tagged FoxP3RBR-forkhead with and without mutations in A372, all showing only one population corresponding to monomers.
E. EMSA of NusA-tagged FoxP3RBR-forkhead (0, 0.4 and 0.8 μM) with and without mutations in A372. DNA with IR-FKHM4g was used.
F. SEC-MALS of NusA-tagged FoxP1RBR-forkhead, FoxP2RBR-forkhead, FoxP3RBR-forkhead and FoxP4RBR-forkhead, all showing only one population corresponding to monomers.
Data in (B-F) are representative of at least three independent experiments.
