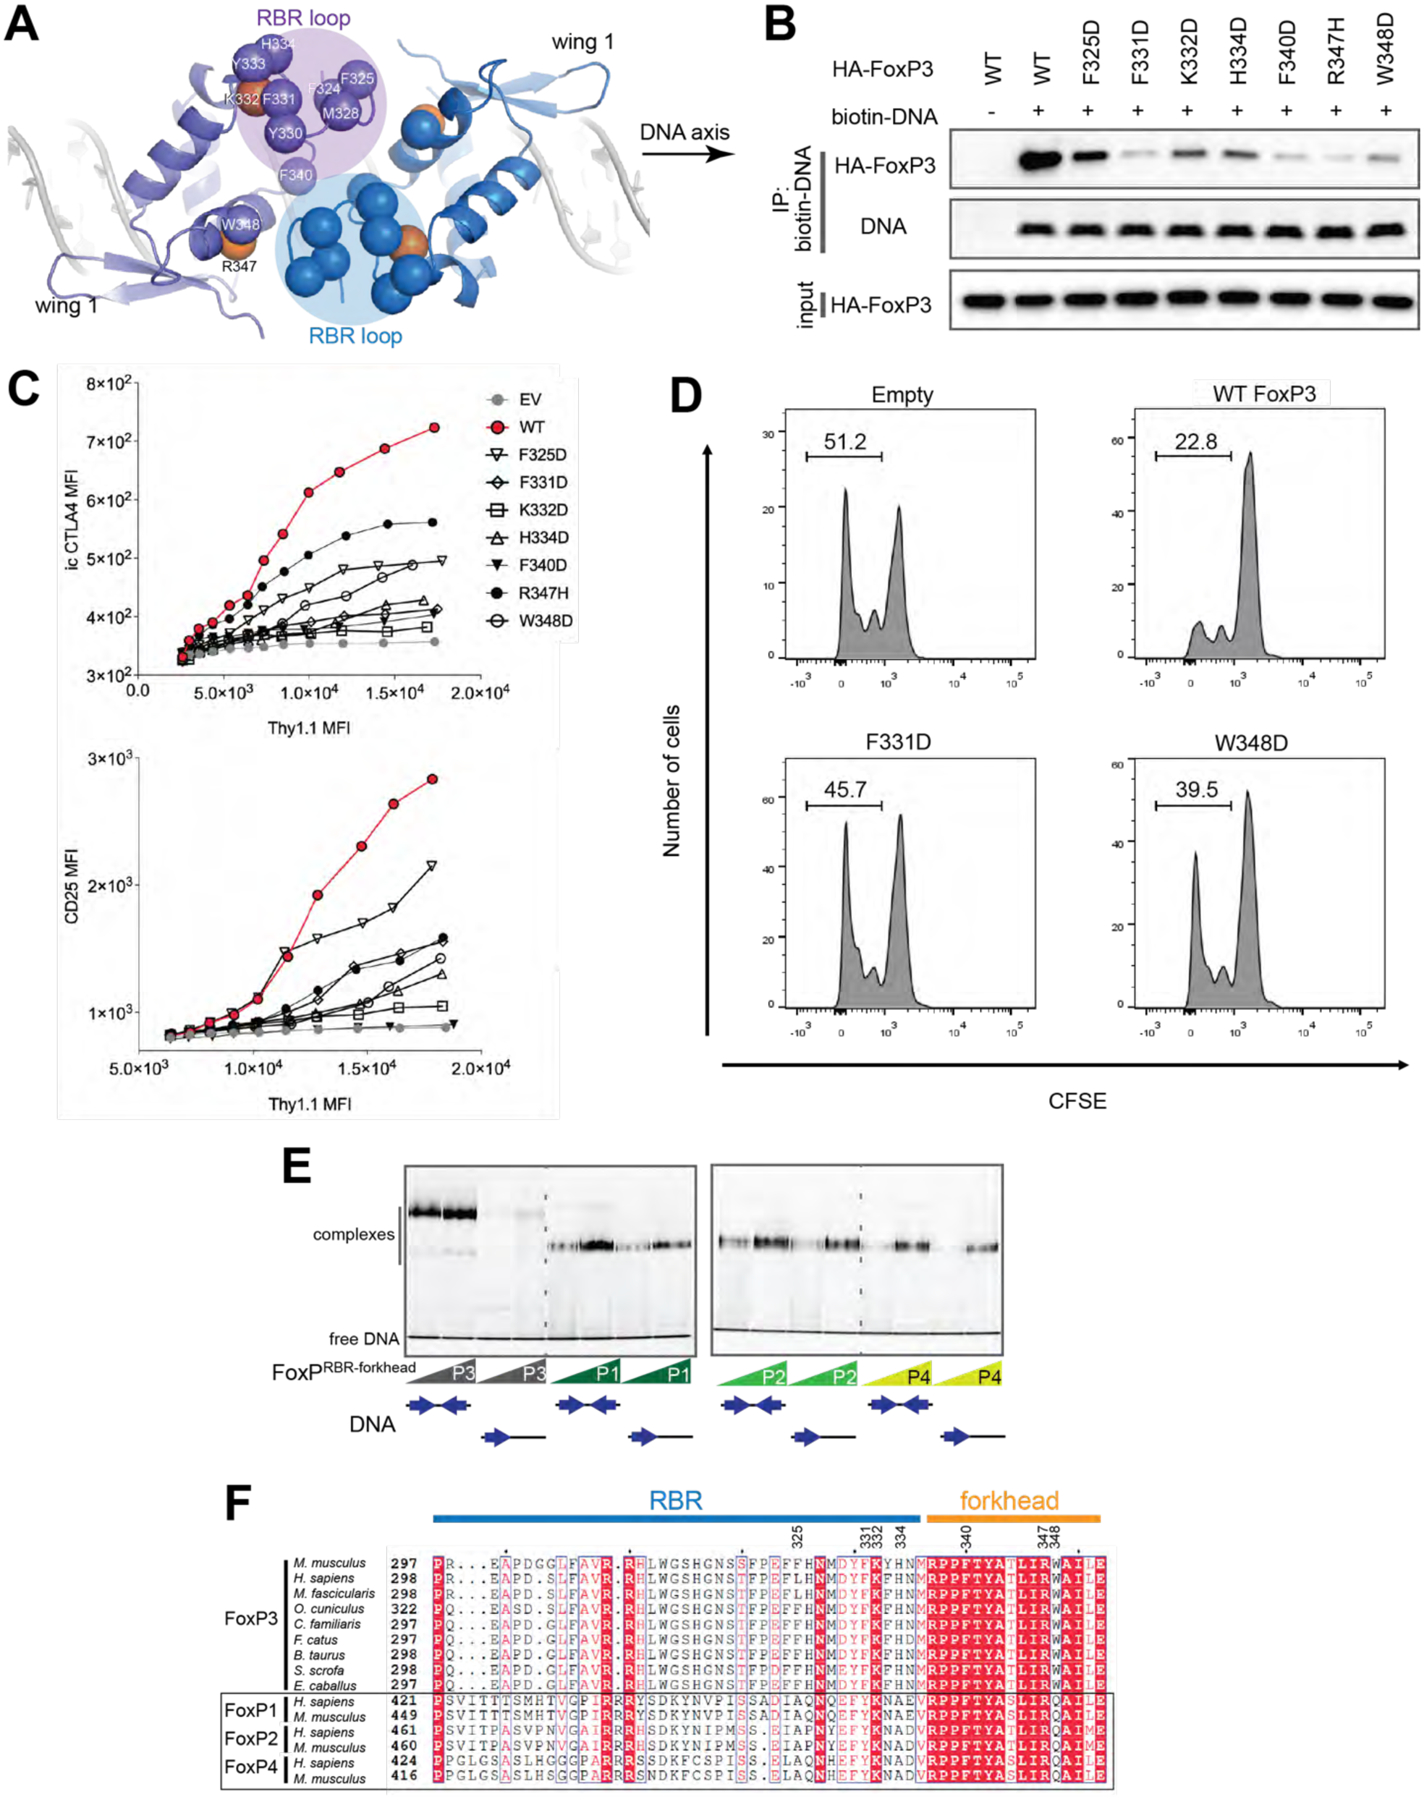
Figure 3. RBR loop-mediated H-H dimerization is important for and unique to FoxP3.

See also Figure S4.
A. Top view of the FoxP3 H-H dimer. The RBR loop forms the interface through the RBR–RBR and RBR–forkhead interactions. Hydrophobic residues (Cα) at or near the interface are shown in blue or purple spheres. K332 and R347 are shown in orange spheres.
B. DNA binding activity of H-H interface mutants. Biotinylated DNA with IR-FKHM4g was used to pull-down FoxP3 (WT or mutants) ectopically expressed in 293T cells.
C. Transcriptional activity of the H-H interface mutants. Experiments were performed as in Figure 2C.
D. T cell suppression assay of FoxP3. CD4+ T cells were retrovirally transduced to express FoxP3 with and without mutations (F331D and W348D) and their suppressive effect on proliferation of the responder T cells was examined. Shown is the representative histogram depicting the CFSE dilution profile of responder T cells cultured with FoxP3-expressing suppressor cells at a ratio of 1:2 (suppressors:responders).
E. EMSA of NusA-tagged FoxP1–4 (0.4 and 0.8 μM) using DNA oligos (0.2 μM) with IR-FKHM4g or single FKHM. All proteins were RBR-forkhead domains fused with NusA.
F. Sequence alignment of FoxP3 orthologs and paralogs in the FoxP family.
Data in (B-E) are representative of at least three independent experiments.
