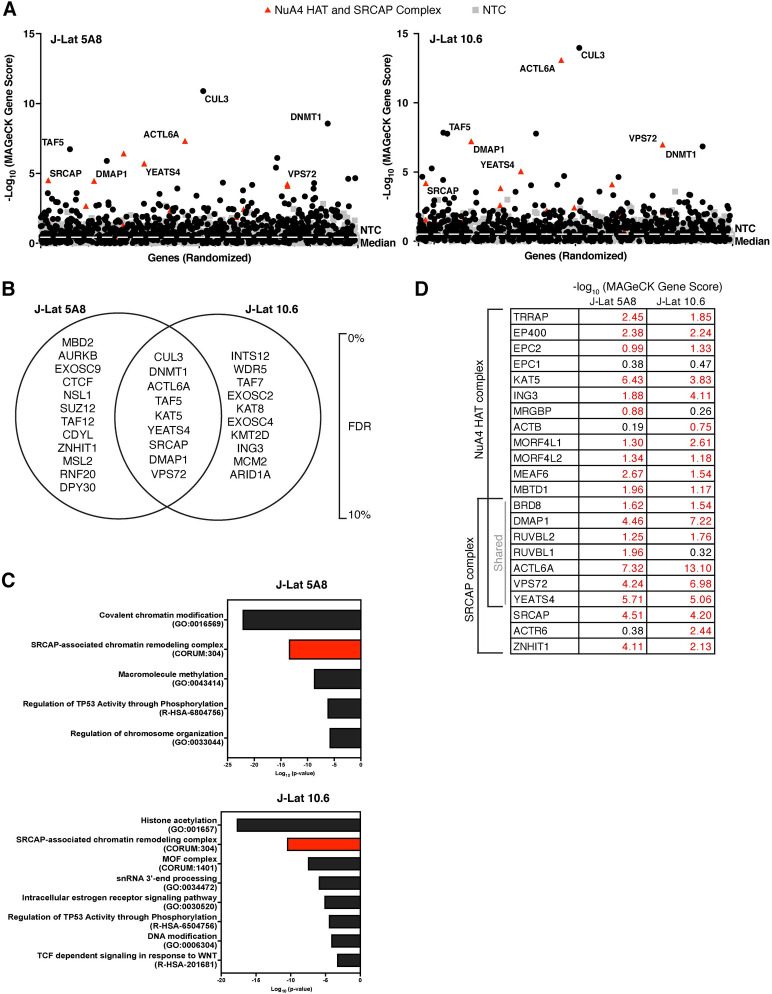
Fig 3. The Latency HIV-CRISPR screen in J-Lat 10.6 and J-Lat 5A8 cells identifies a set of mutual, novel hits.
(A) The -log10 of the MAGeCK scores for each gene targeted by the HuEpi sgRNA library (black circles and red triangles) and NTCs (gray squares) are calculated and displayed. Gene names are labelled for hits that have a <10% false discovery rate (FDR) in both J-Lat cell lines (center of Venn diagram in (B)); red triangles represent members of the NuA4 HAT complex and SRCAP complex. NTCs are artificial NTC genes designed by iterative binning of NTC sgRNA sequences (see Methods). Genes are randomized on the x-axis, but the same order is used for both right and left panels. The y-axis is the inverse log10 of the MAGeCK score. (B) Top hit genes (<10% FDR) in common and unique to each J-Lat cell line are ordered by significance and FDR with the top of the list having the highest significance and lowest FDR. (C) Metascape GO analysis [44] of the gene hits with a <10% FDR in each J-Lat cell line. (D) Analysis of the -log10 of the MAGeCK scores of the genes overlapping and unique to the NuA4 HAT and SRCAP complex compared to the NTCs. The higher the number, the more statistically significant it is of a hit. Red font is for genes that score higher than the average NTC score.

