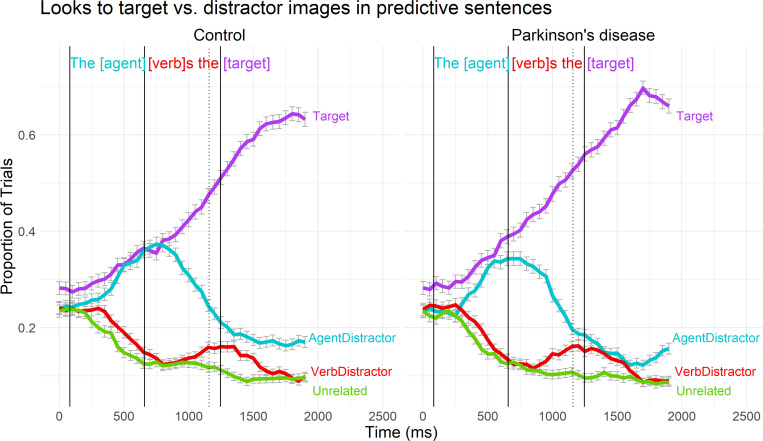
Fig 2. Gaze data by group in predictive sentences.
Binned binomial gaze probabilities to each area of interest, averaged across subjects and trials over the duration of the predictive sentences for controls (left) and PD participants (right). The x-axis reflects the elapsed time in the trial in milliseconds, offset by 200ms to account for saccade programming/launching time. The solid vertical lines mark the onset of the agent, verb, and target words. The dotted vertical line marks the end of the verb statistical analysis window (which extends only partially into the post-verb article). Error bars represent standard error of the mean.

