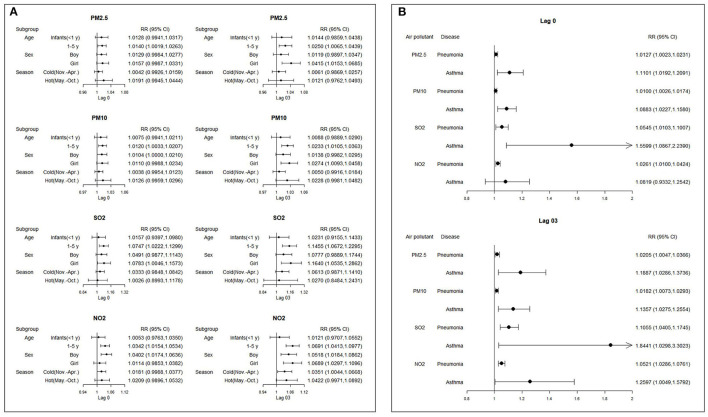
Figure 2.
RR (Rate ratios) and 95% CIs (confidence intervals) following a 10-μg/m3 increase on lag0 and lag03 of all cases and different subgroups ambient air pollution concentrations and hospital admissions for pneumonia and asthma. (A) Subgroup analyses by age, sex and season. (B) Subgroup analyses by pathology).

