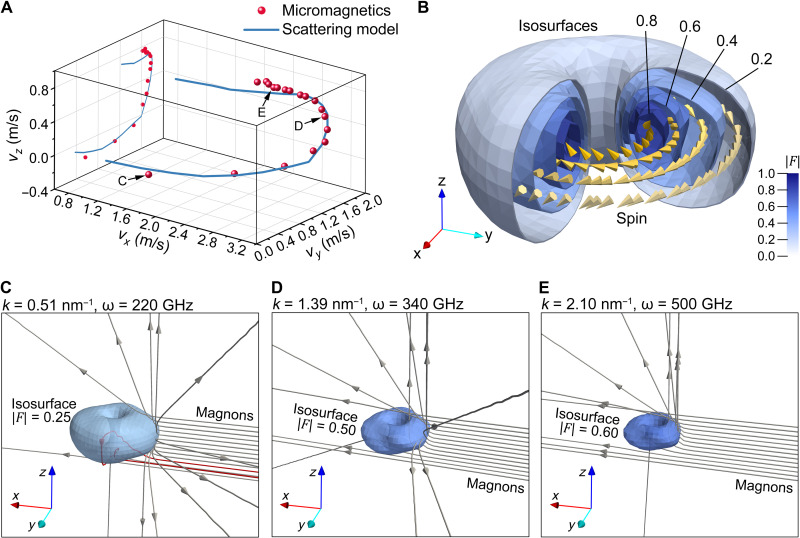
Fig. 5. Frequency dependence of magnon scattering.
(A) Velocities of hopfions driven by CCW-C waves at different frequencies. The red points denote the values of the velocities obtained from micromagnetic simulation for frequencies from 220 to 560 GHz in a step of 20 GHz. The blue line is the velocity calculated from the magnon-hopfion interaction model. Both of them are projected onto the yz plane to show their relative position from the side view. (B) Emergent magnetic field F of a hopfion. The isosurfaces of ∣F∣ with values of 0.2, 0.4, 0.6, and 0.8 are exhibited in an increasing depth of blue. The direction of F on the equatorial plane in each shell is represented by a chain of yellow cones. (C to E) Paths of certain magnons in the real space for three specifically selected frequencies. The wave number k and the frequency ω are labeled at the top of each figure. The color depth of a isosurface indicates the magnitude of ∣F∣. The magnitude of the field F on these isosurfaces is no more than it is required to reflect all the magnons. The gray trajectories with arrows on them are the paths of magnons, which are scattered by the field. Some of them are painted red to distinguish themselves from their neighbors. The positions of these arrows are a snapshot of all the outgoing magnons at the same simulation time.

