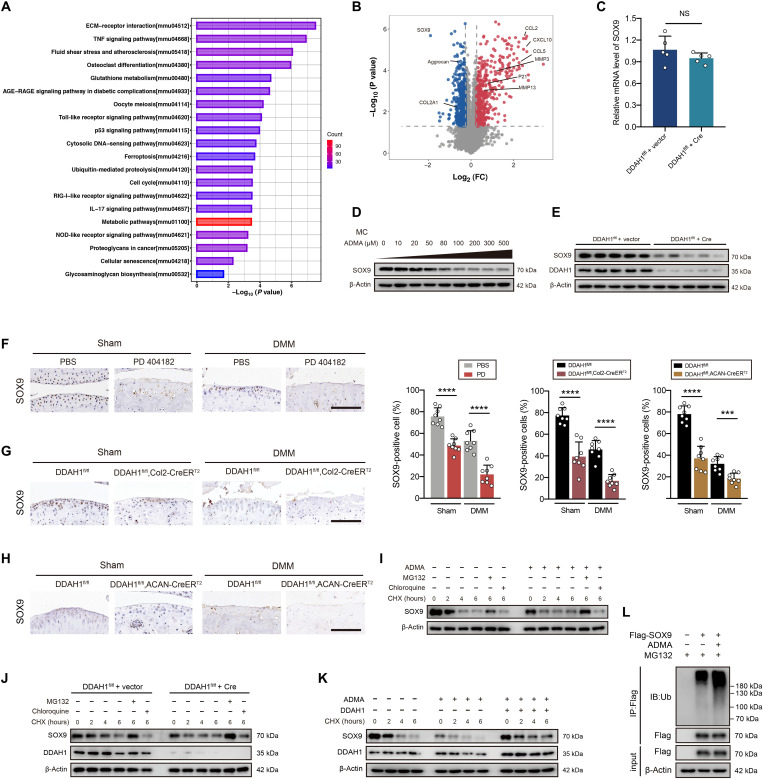
Fig. 3. ADMA induces SOX9 degradation through the ubiquitin-proteasome pathway.
(A and B) KEGG analysis and volcano plots (fold change >1.2 or <0.83, P < 0.05) of the differentially expressed proteins between chondrocytes treated with ADMA or control. (C) The relative mRNA expression of SOX9 in DDAH1fl/fl chondrocytes infected with Cre adenovirus or vector. (D and E) Immunoblot detection of SOX9 or DDAH1 in mouse chondrocytes exposed to ADMA or DDAH1-knockout chondrocytes. (F) Immunoblot detection of SOX9 in cartilage of mice that underwent DMM surgery accompanied by PD 404182 articular injection weekly. n = 8 per group. Scale bar, 100 μm. (G and H) Immunoblot of SOX9 in cartilage of DDAH1fl/fl and DDAH1fl/fl, Col2-CreERT2 or DDAH1fl/fl, ACAN-CreERT2 mice that underwent DMM surgery or sham. n = 8 per group. Scale bar, 100 μm. (I and J) Immunoblot of SOX9 or DDAH1 in mouse chondrocytes exposed to ADMA or with DDAH1 knockout. Where indicated, cells were pretreated with either MG132 or chloroquine 30 min before cycloheximide (CHX) treatment at indicated times. (K) Immunoblot of SOX9 and DDAH1 in mouse chondrocytes. Cells were treated with ADMA, DDAH1 lentivirus (or vector), and CHX at the indicated times. (L) Immunoblot detection of ubiquitinated species of Flag in 293T cells via Flag immunoprecipitation. Cells were transfected with Flag-SOX9 and treated with ADMA for 24 hours and MG132 for 6 hours before harvesting. Data are representative of three independent experiments (D, E, and I to L). ***P < 0.001, ****P < 0.0001, means ± SD, unpaired two-tailed t test.

