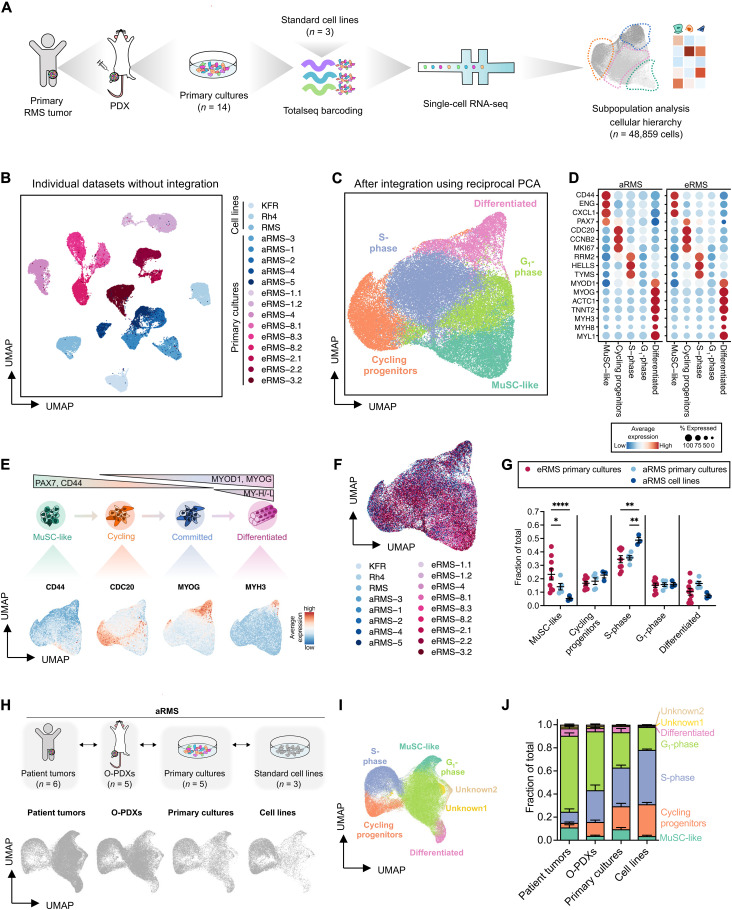
Fig. 1. scRNAseq of RMS identifies heterogeneity recapitulating muscle developmental programs.
(A) Experimental workflow. (B) UMAP plot of 48,859 RMS cells after regressing the number of count RNA, the percentage of mitochondrial genes, and the run batch effect. Cells are color-coded based on the corresponding sample of origin. (C) UMAP plot of 48,859 RMS cells after integration. Populations identified by Louvain clustering are shown. (D) Dot plot showing expression of lineage-specific marker genes across the different Louvain clusters in aRMS and eRMS samples. (E) Model of skeletal myogenesis with the populations identified in RMS. UMAP plots are colored on the basis of the expression of markers delineating a myogenic lineage progression. (F) UMAP plot of RMS cells after integration and color-coded based on the sample of origin. (G) Relative proportion of Louvain clusters. Data are represented as means ± SEM; ordinary two-way analysis of variance (ANOVA) with uncorrected Fisher’s least significant difference (LSD). *P < 0.05; **P < 0.01; ****P ≤ 0.0001. (H and I) Comparison of intratumoral heterogeneity between preclinical models of aRMS. O-PDXs and patient tumor data are derived from (36). UMAP plots of individual models (H) and of the integrated datasets (I) are shown. (J) Relative proportion of Louvain clusters across different aRMS preclinical models and patient tumors. Data are represented as means ± SEM of n = 6 patient tumors, n = 5 O-PDXs, n = 5 primary cultures, and n = 3 cell lines.

