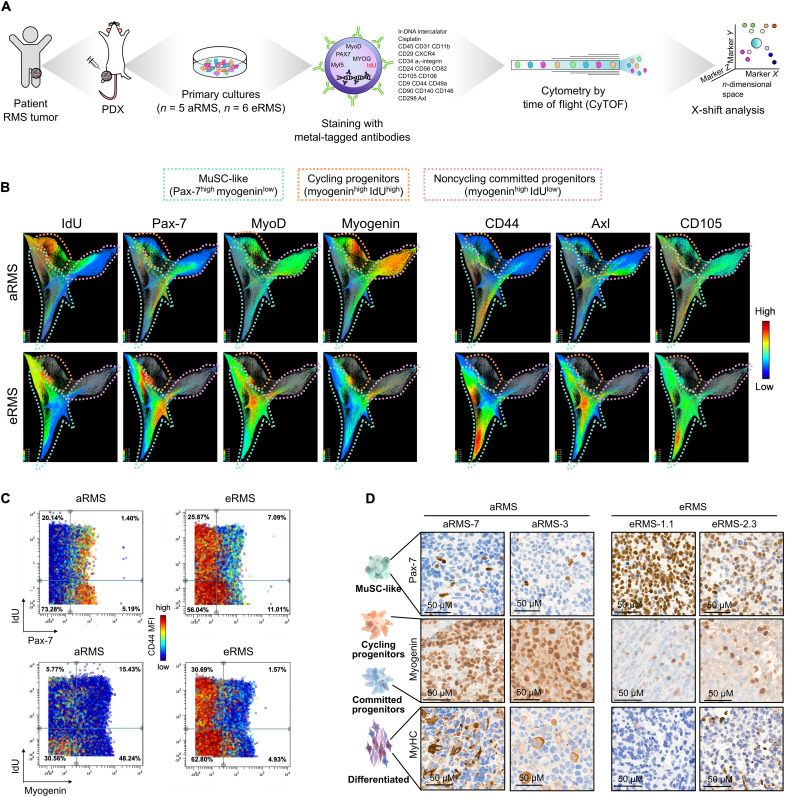
Fig. 2. CyTOF defines RMS subpopulations with high resolution.
(A) Mass cytometry workflow. (B) Integrated CyTOF dataset from RMS primary cultures clustered with the X-shift algorithm and visualized using single-cell force-directed layout. (C) Biaxial dot plots of Pax-7 or myogenin by IdU across aRMS and eRMS primary cultures. Plots are colored by CD44 expression. (D) Expression of Pax-7, myogenin, and MyHC markers as determined by immunohistochemistry in PDX tumors.

