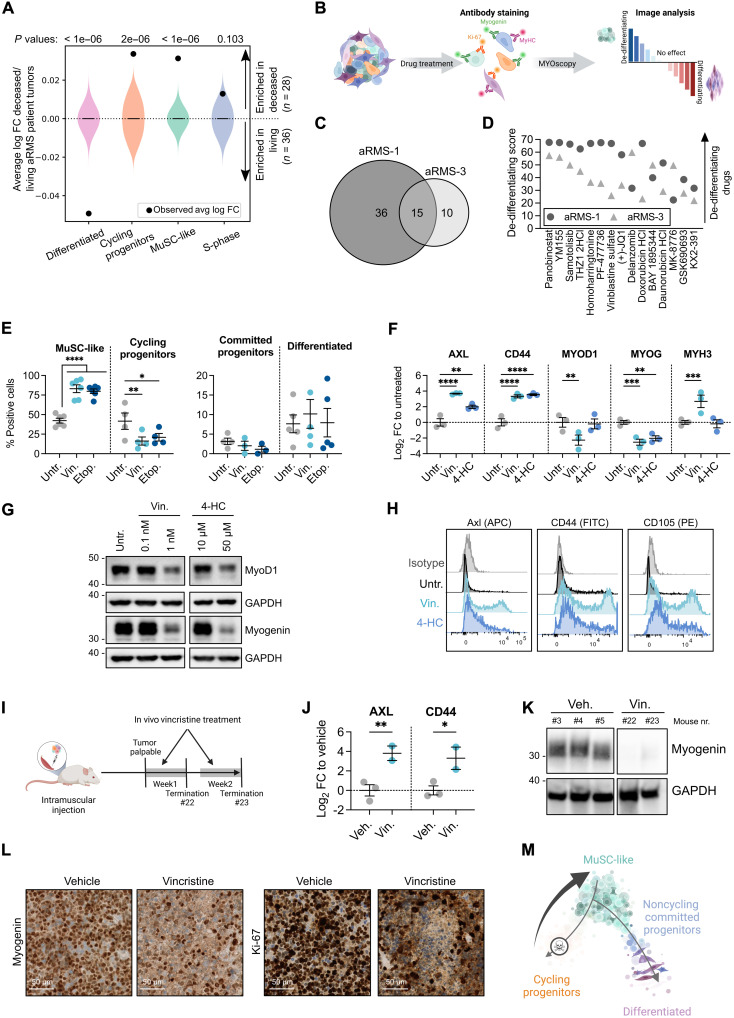
Fig. 5. Chemotherapy induces a transition toward MuSC-like states in aRMS.
(A) Association between cluster-associated signatures and aRMS patient outcome. Violin plots show log fold change distributions between deceased and living patients assuming no association (107 simulation replicates). Black dots represent the calculated associations. (B) Experimental workflow. (C) Number of dedifferentiating drug hits at 1 μM. (D) Shared dedifferentiating drugs at 1 μM ranked on the basis of the average dedifferentiating score. A score of zero represents the baseline score of untreated controls. (E) Immunofluorescence quantification of aRMS-1 cells exposed to 10 nM vincristine or 1 μM etoposide for 72 hours; ordinary two-way ANOVA with uncorrected Fisher’s LSD. (F) qRT-PCR data generated with aRMS-1 cells exposed to 10 nM vincristine sulfate or 50 μM 4-HC for 48 hours; ordinary two-way ANOVA with uncorrected Fisher’s LSD. (G) WB images of aRMS-1 cells exposed to vincristine or 4-HC for 48 hours. GAPDH was used as loading control; samples were loaded on the same gel. (H) Representative FACS plots of aRMS-1 cells treated with 1 nM vincristine or 10 μM 4-HC for 48 hours. (I) Experimental workflow. (J) qRT-PCR data generated with aRMS-1 tumors collected after in vivo treatment with vincristine (10 mg/kg); ordinary two-way ANOVA with uncorrected Fisher’s LSD. (K) WB images of aRMS-1 PDX tumors treated in vivo with vincristine. Samples were loaded on the same gel. (L) Expression of myogenin and Ki-67 as determined by immunohistochemistry in aRMS-1 PDX tumors following in vivo treatment with vincristine or vehicle. (M) Proposed model of treatment selection following chemotherapy in aRMS. *P < 0.05; **P < 0.01; ***P < 0.001; ****P ≤ 0.0001. Data are represented as means ± SEM of the indicated number of biological replicates. Untr., untreated; Vin, vincristine sulfate; 4-HC, 4-hydroperoxycyclophosphamide; Veh, vehicle; FC, fold change.

