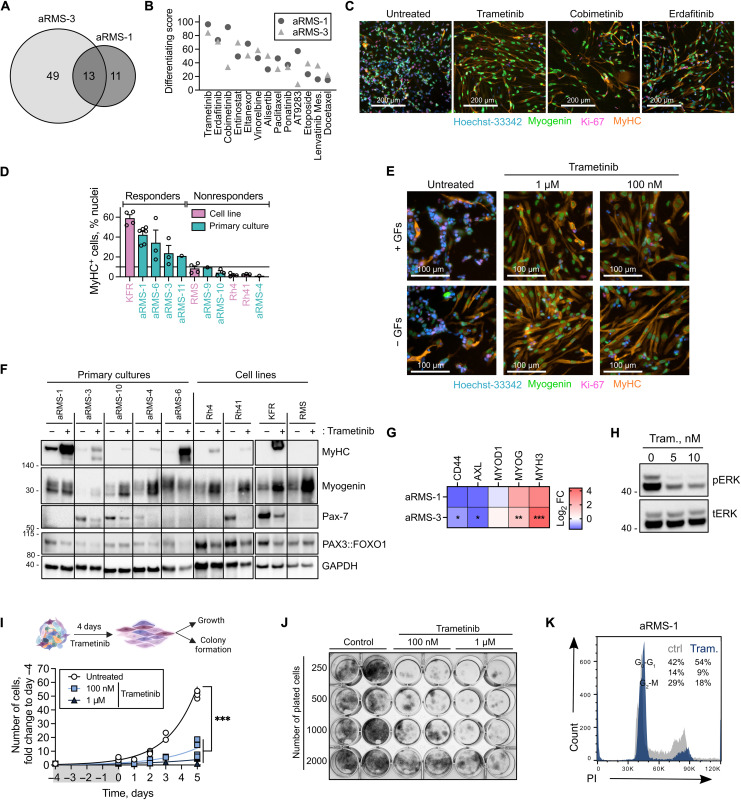
Fig. 6. Image-based high-content drug screening identifies the MEK inhibitor trametinib as a potent inducer of myogenic differentiation in aRMS primary cultures.
(A) Number of drug hits promoting differentiation in aRMS-1 and aRMS-3 at 1 μM. (B) Shared differentiating drugs at 1 μM ranked on the basis of the average differentiating score across aRMS-1 and aRMS-3 cells. (C) Representative images of aRMS-1 cells following 72 hours of drug treatment at 1 μM. (D) Percentage of differentiated (MyHC+) cells following treatment with 100 nM trametinib for 72 hours. Data are represented as means ± SEM of the indicated number of biological replicates. A threshold of 10% was used to separate responders from nonresponders. (E) Representative images of aRMS-1 cells following 72 hours of drug treatment with trametinib in the presence (+GFs) or absence (−GFs) of the growth factors bFGF and EGF. (F) WBs of aRMS primary cultures and cell lines exposed to 50 nM trametinib for 96 hours. (G) qRT-PCR data of aRMS-1 and aRMS-3 cells exposed to 50 nM trametinib for 96 hours. Data are represented as means ± SEM of n ≥ 2 biological replicates; multiple unpaired t tests. (H) WB analysis of phosphorylated ERK in aRMS-1 cells after exposure to trametinib for 3 hours. (I) Proliferation curve of aRMS-1 cells exposed to trametinib for 4 days (gray bar) and cultivated in drug-free medium for further 5 days, as determined by cell counting; ordinary two-way ANOVA with Dunnett’s correction. (J) Colony-forming ability of aRMS-1 cells exposed to trametinib for 4 days and seeded at the indicated cell densities in duplicates in drug-free medium for 10 days. (K) Representative cell cycle analysis plot of aRMS-1 cells exposed to 25 nM trametinib for 96 hours and stained with propidium iodide. *P < 0.05; **P < 0.01; ***P < 0.001.

