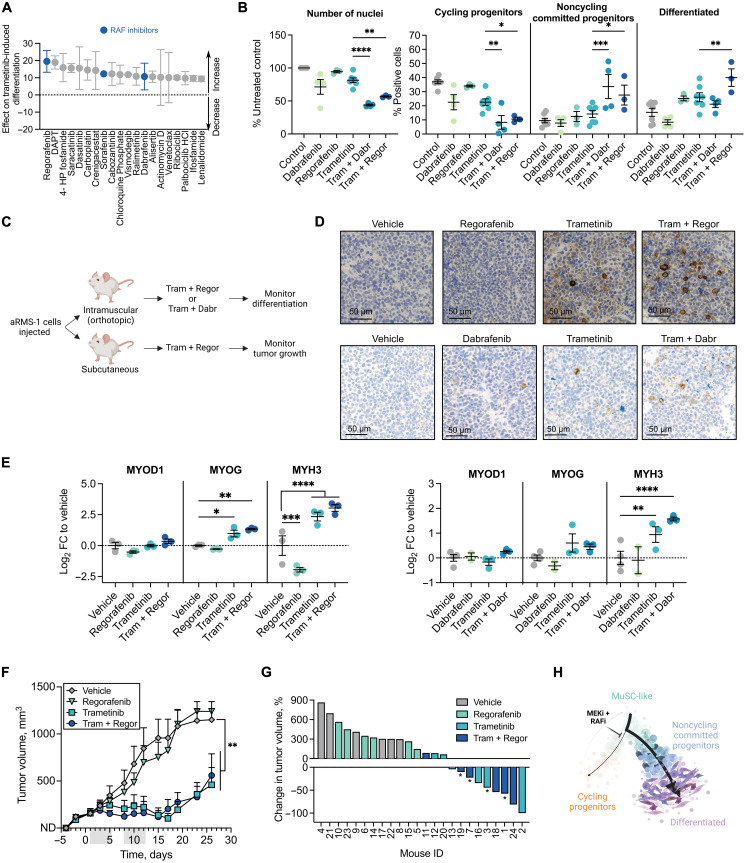
Fig. 7. Vertical inhibition of the RAF-MEK-ERK cascade potentiates trametinib-induced differentiation and inhibits aRMS tumor growth.
(A) Top 20 trametinib-potentiating drugs ranked on the basis of their effect on trametinib-induced differentiation. A score of zero represents the baseline score of trametinib alone; drugs with a positive score potentiate trametinib-induced differentiation. n = 2 biological replicates. (B) Quantification of immunofluorescence analysis of aRMS-1 cells exposed to vehicle controls, 10 μM dabrafenib (Dabr), 1 μM regorafenib (Regor), 10 nM trametinib (Tram), or the indicated combinations for 72 hours; ordinary two-way ANOVA with uncorrected Fisher’s LSD. (C) Schematic of in vivo validation experiment. (D) Expression of MyHC as determined by immunohistochemistry in aRMS-1 PDX tumors following in vivo treatment with trametinib (5 mg/kg), regorafenib (15 mg/kg), or their combination (top row) or with trametinib (1 mg/kg), dabrafenib (15 mg/kg), or their combination (bottom row). (E) qRT-PCR analysis of aRMS-1 PDX tumors; ordinary two-way ANOVA with uncorrected Fisher’s LSD. (F) Monitoring of tumor growth in mice that were injected with aRMS-1 cells and treated with vehicle, trametinib (5 mg/kg), regorafenib (15 mg/kg), or their combination for two cycles (gray bars); ordinary two-way ANOVA with Dunnett’s multiple comparison correction. (G) Waterfall plot showing the change in tumor volume in mice treated with vehicle, trametinib (5 mg/kg), regorafenib (15 mg/kg), or their combination, at the end of the treatment period (day 12). Mice marked with “*” had to be euthanized before the treatment end point due to toxicity. (H) Proposed model of trajectory rewiring in aRMS following treatment with the MEK inhibitor (MEKi) trametinib in combination with the RAF inhibitor (RAFi) regorafenib or dabrafenib. *P < 0.05; **P < 0.01; ***P < 0.001; ****P ≤ 0.0001. Data points are represented as means ± SEM of the indicated number of biological replicates.

