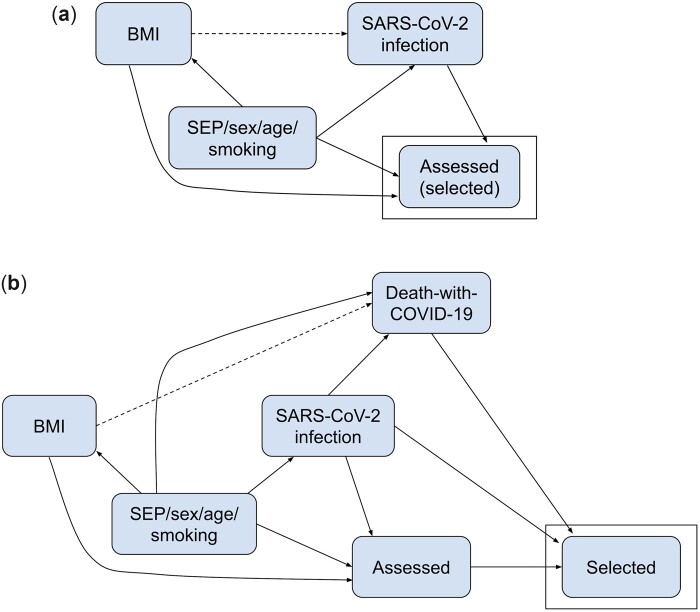
Figure 1.
Directed acyclic graphs depicting assumed causal models for empirical and simulation scenarios. (a) SARS-CoV-2 infection. Dashed lines indicate the causal effect we are estimating. Simulations based on Avon Longitudinal Study of Parents and Children (ALSPAC) and UK Biobank (UKB) data. Participants were assessed (and hence selected) if they reported whether they have had a SARS-CoV-2 infection in ALSPAC or had a SARS-CoV-2 polymerase chain reaction (PCR) test result in UKB. (b) Death-with-COVID-19. Dashed lines indicate the causal effect we are estimating. Simulations based on UKB data only. Participants were selected if they were assessed [as in (a)] and tested positive or if they died with COVID-19. An arrow from Node A to Node B in a directed acyclic graph (DAG) indicates that A is a direct cause of B (i.e. A affects B not only through another node in the DAG). DAGs do not describe ‘how’ this effect occurs, i.e. the specific model describing this relationship, including whether nodes interact in their effects. For example, in DAG (b), infection is a direct cause of death-with-COVID-19 as a person can only die with COVID-19 if they are infected. Thus, infection interacts with all other direct effects of death-with-COVID-19. For example, smoking directly affects the risk of dying with COVID-19 only among those with a SARS-CoV-2 infection (i.e. the effect of smoking on death-with-COVID-19 depends on SARS-CoV-2 infection status). BMI, body mass index; SEP, socio-economic position.

