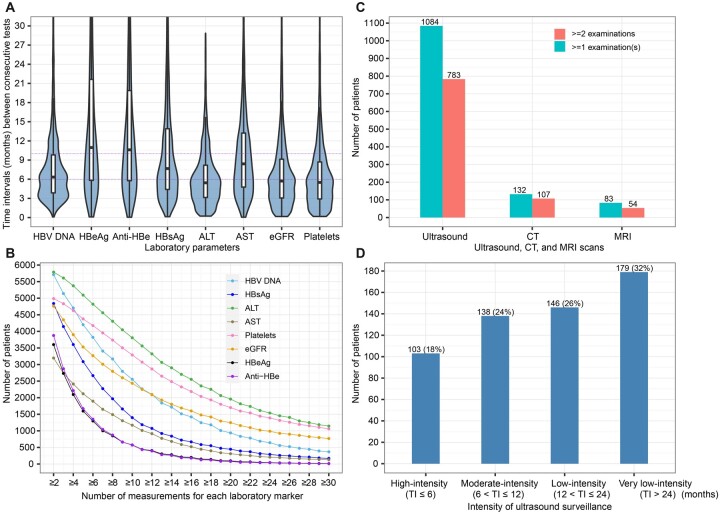
Figure 3.
Follow-up frequency and longitudinal data availability. (A) Time intervals (months) between two consecutive tests within patients of hepatitis B virus serological and virological biomarkers, liver biochemistry parameters and renal function markers. (B) Numbers of patients who had longitudinal data (i.e. ≥ two measurements) of laboratory markers [hepatitis B virus deoxyribonucleic acid (HBV DNA), hepatitis B surface antigen (HBsAg), hepatitis B e antigen (HBeAg), antibody to HBeAg (Anti-HBe), alanine aminotransferase (ALT), aspartate aminotransferase (AST), estimated glomerular filtration rate (eGFR), platelets] during the follow-up period. (C) Patients with ultrasound, computed tomography (CT), or magnetic resonance imaging (MRI) surveillance data with various numbers of examinations. (D) Patients with differing intensity of ultrasound surveillance for those who had two or more ultrasound scans. In panel A, mean value of time intervals between every two consecutive tests for each patient was calculated, then the violin plot and boxplot were drawn based on these mean values with outliers (the observations below the 1st percentile and the observations above the 99th percentile) removed. Boxplots indicate the median and quartiles with whiskers reaching up to 1.5 times the interquartile range. The violin plot outlines illustrate kernel probability density, i.e. the width of the blue shaded area represents the proportion of the data located there. Data beyond 30 months were not shown in the plots. In panel B, the x-axis indicates the number of measurements for patients who had longitudinal data (i.e., two or more measurements) on a test. TI, time interval

