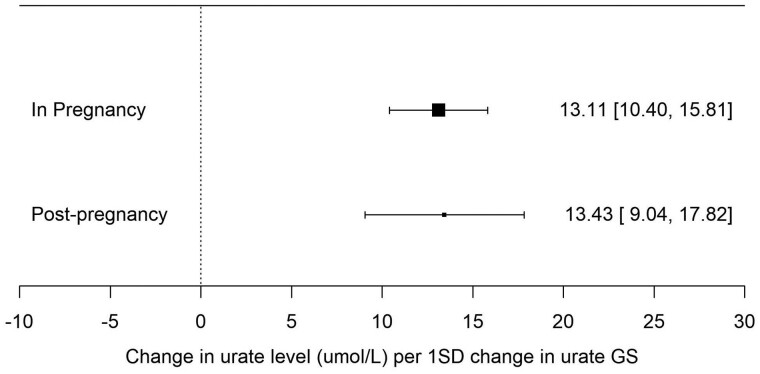
Figure 3.
Forest plot of the association between a 110-SNP urate genetic score and urate levels measured in pregnancy (n = 872) and post-pregnancy (n = 470) in the Exeter Family Study of Childhood Health. Each estimate is the change in urate level (µmol/L) per 1-SD change in urate genetic score (95% CI). The sizes of the black boxes are a reflection of the sample size for each analysis—the larger the box, the greater the sample size, with the bracketing segments representing the 95% CIs. GS, genetic score

