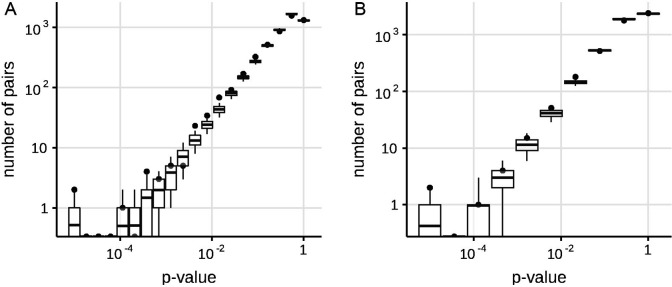
Appendix 1—figure 1. Numbers of predicted concordantly (A) and discordantly (B) evolving pairs for different nominal p-values in the simulated data in non-epistatic mode of evolution, compared to the null distribution for the ML phylogeny reconstructed by IQ-TREE.
Black dots indicate numbers of site pairs having corresponded p-values in the simulated data, boxes with whiskers indicate distributions of numbers of site pairs having corresponded p-values among 400 samples from the null model (see Methods). Top and bottom of each box correspond to the 75th and 25th percentile, whiskers correspond to the 95th and 5th percentile. Vertical line corresponds to the 10% FDR threshold.

