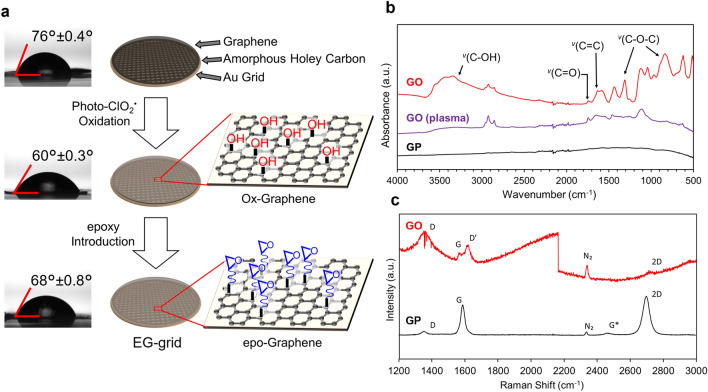
Figure 1.
Fabrication process of the EG-grid and characterization of the graphene surface. (a) Water contact angle measurement and schematic illustration of EG-grid preparation by oxidation and functionalization of graphene on the Quantifoil Au grid. Data are obtained as the mean of three independent experiments with standard deviation. (b) IR spectra of pristine graphene (GP: black line), plasma treated graphene (GO (plasma): purple line), and oxidized graphene after 10 min ClO2· treatment (GO: red line) on Cu foil. (c) Raman spectra of GP (black line) and GO (red line) on silicon wafer.

