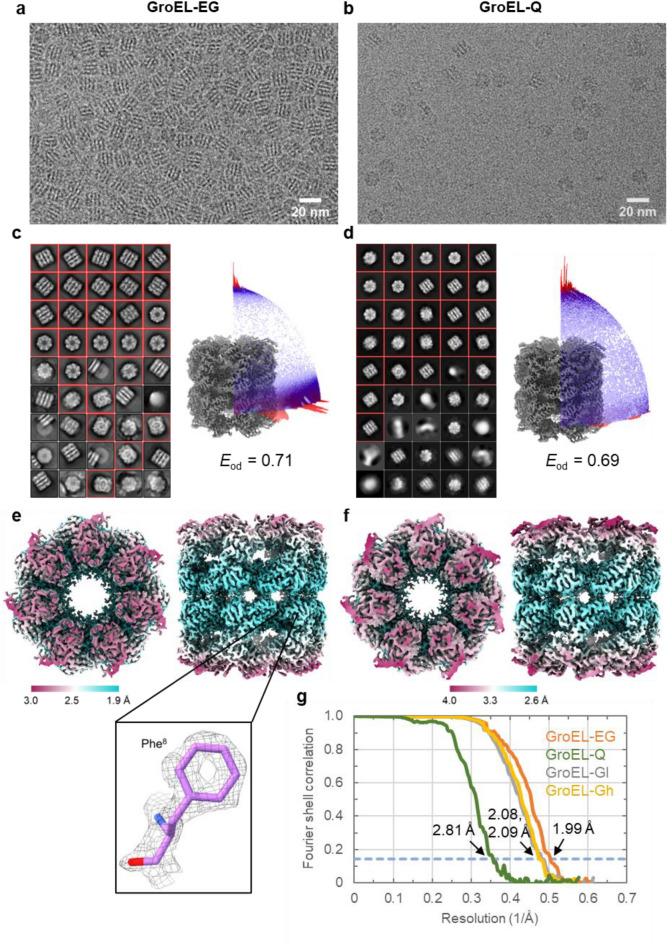
Figure 2.
CryoEM image analyses of GroEL on the EG-grid and holey carbon grid. (a and b) Typical cryoEM images of GroEL on the EG-grid (GroEL-EG) (a) and on the glow discharged Quantifoil grid (GroEL-Q) (b). (c and d) 2D class averages from the GroEL-EG (c) and GroEL-Q (d) dataset. The class averages are aligned in descending order of particle numbers from left to right and top to bottom. The classes selected for the following analysis are indicated with red boxes. Right panel shows angular distribution of particles used in the final refinement for each dataset. Final 3D maps are shown for reference. The efficiencies (Eod) calculated with cryoEF are also shown. (e and f) Two orthogonal views of the final 3D map from the GroEL-EG (e) and GroEL-Q (f) dataset: top view, left panel; and side view, right panel. The local resolution distribution is colored as in the color bar. The inset shows the density map and the fitted model (PDB: 1SX3) around Phe8. (g) The FSC curves for the final maps of the GroEL-EG and GroEL-Q dataset. The dashed blue line indicates the FSC = 0.143 criterion.

