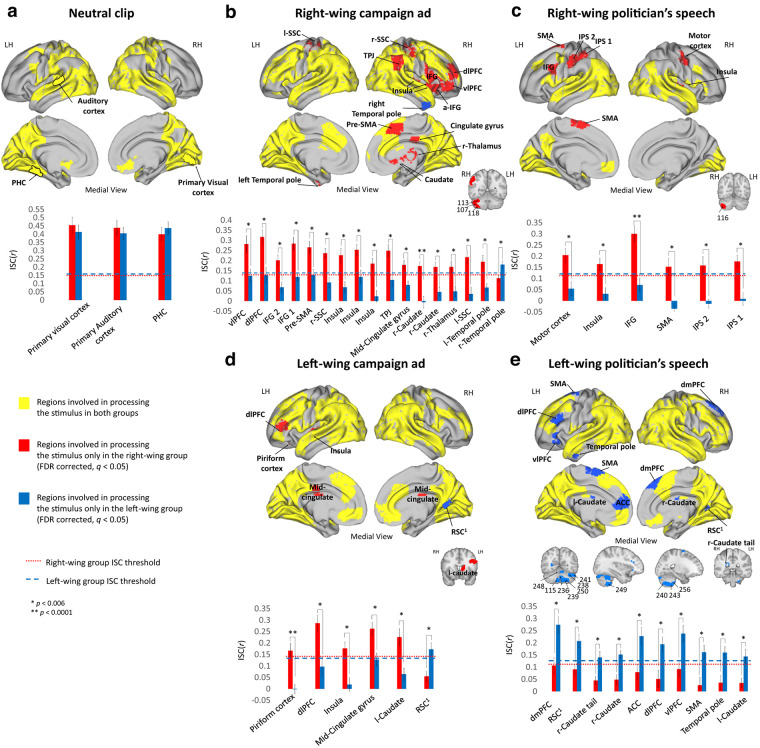
Figure 2.
Similarities and differences in regions involved in processing the video clips. ISC analysis for the (a) Neutral video clip, (b) RWC, (c) RWS, (d) LWC, and (e) LWS. Top panels represent brain maps demonstrating regions involved in processing the stimuli in both groups (overlap between both groups ISC, yellow), only in the right-wing group (red), or only in the left-wing group (blue). Bottom panels represent ISC Pearson r values of both groups in each of the “red” and “blue” brain regions (mean ± SE). Dashed lines indicate the group's ISC threshold. All results are FDR-corrected (q < 0.05). IPS, Intraparietal sulcus; IFG, inferior frontal gyrus; SSC, somatosensory cortex; vlPFC, ventrolateral prefrontal cortex; PHC, para-hippocampus cortex; RSC, adjacent to the retrosplenial cortex; LH, left hemisphere; RH, right hemisphere.

