
Figure 3.
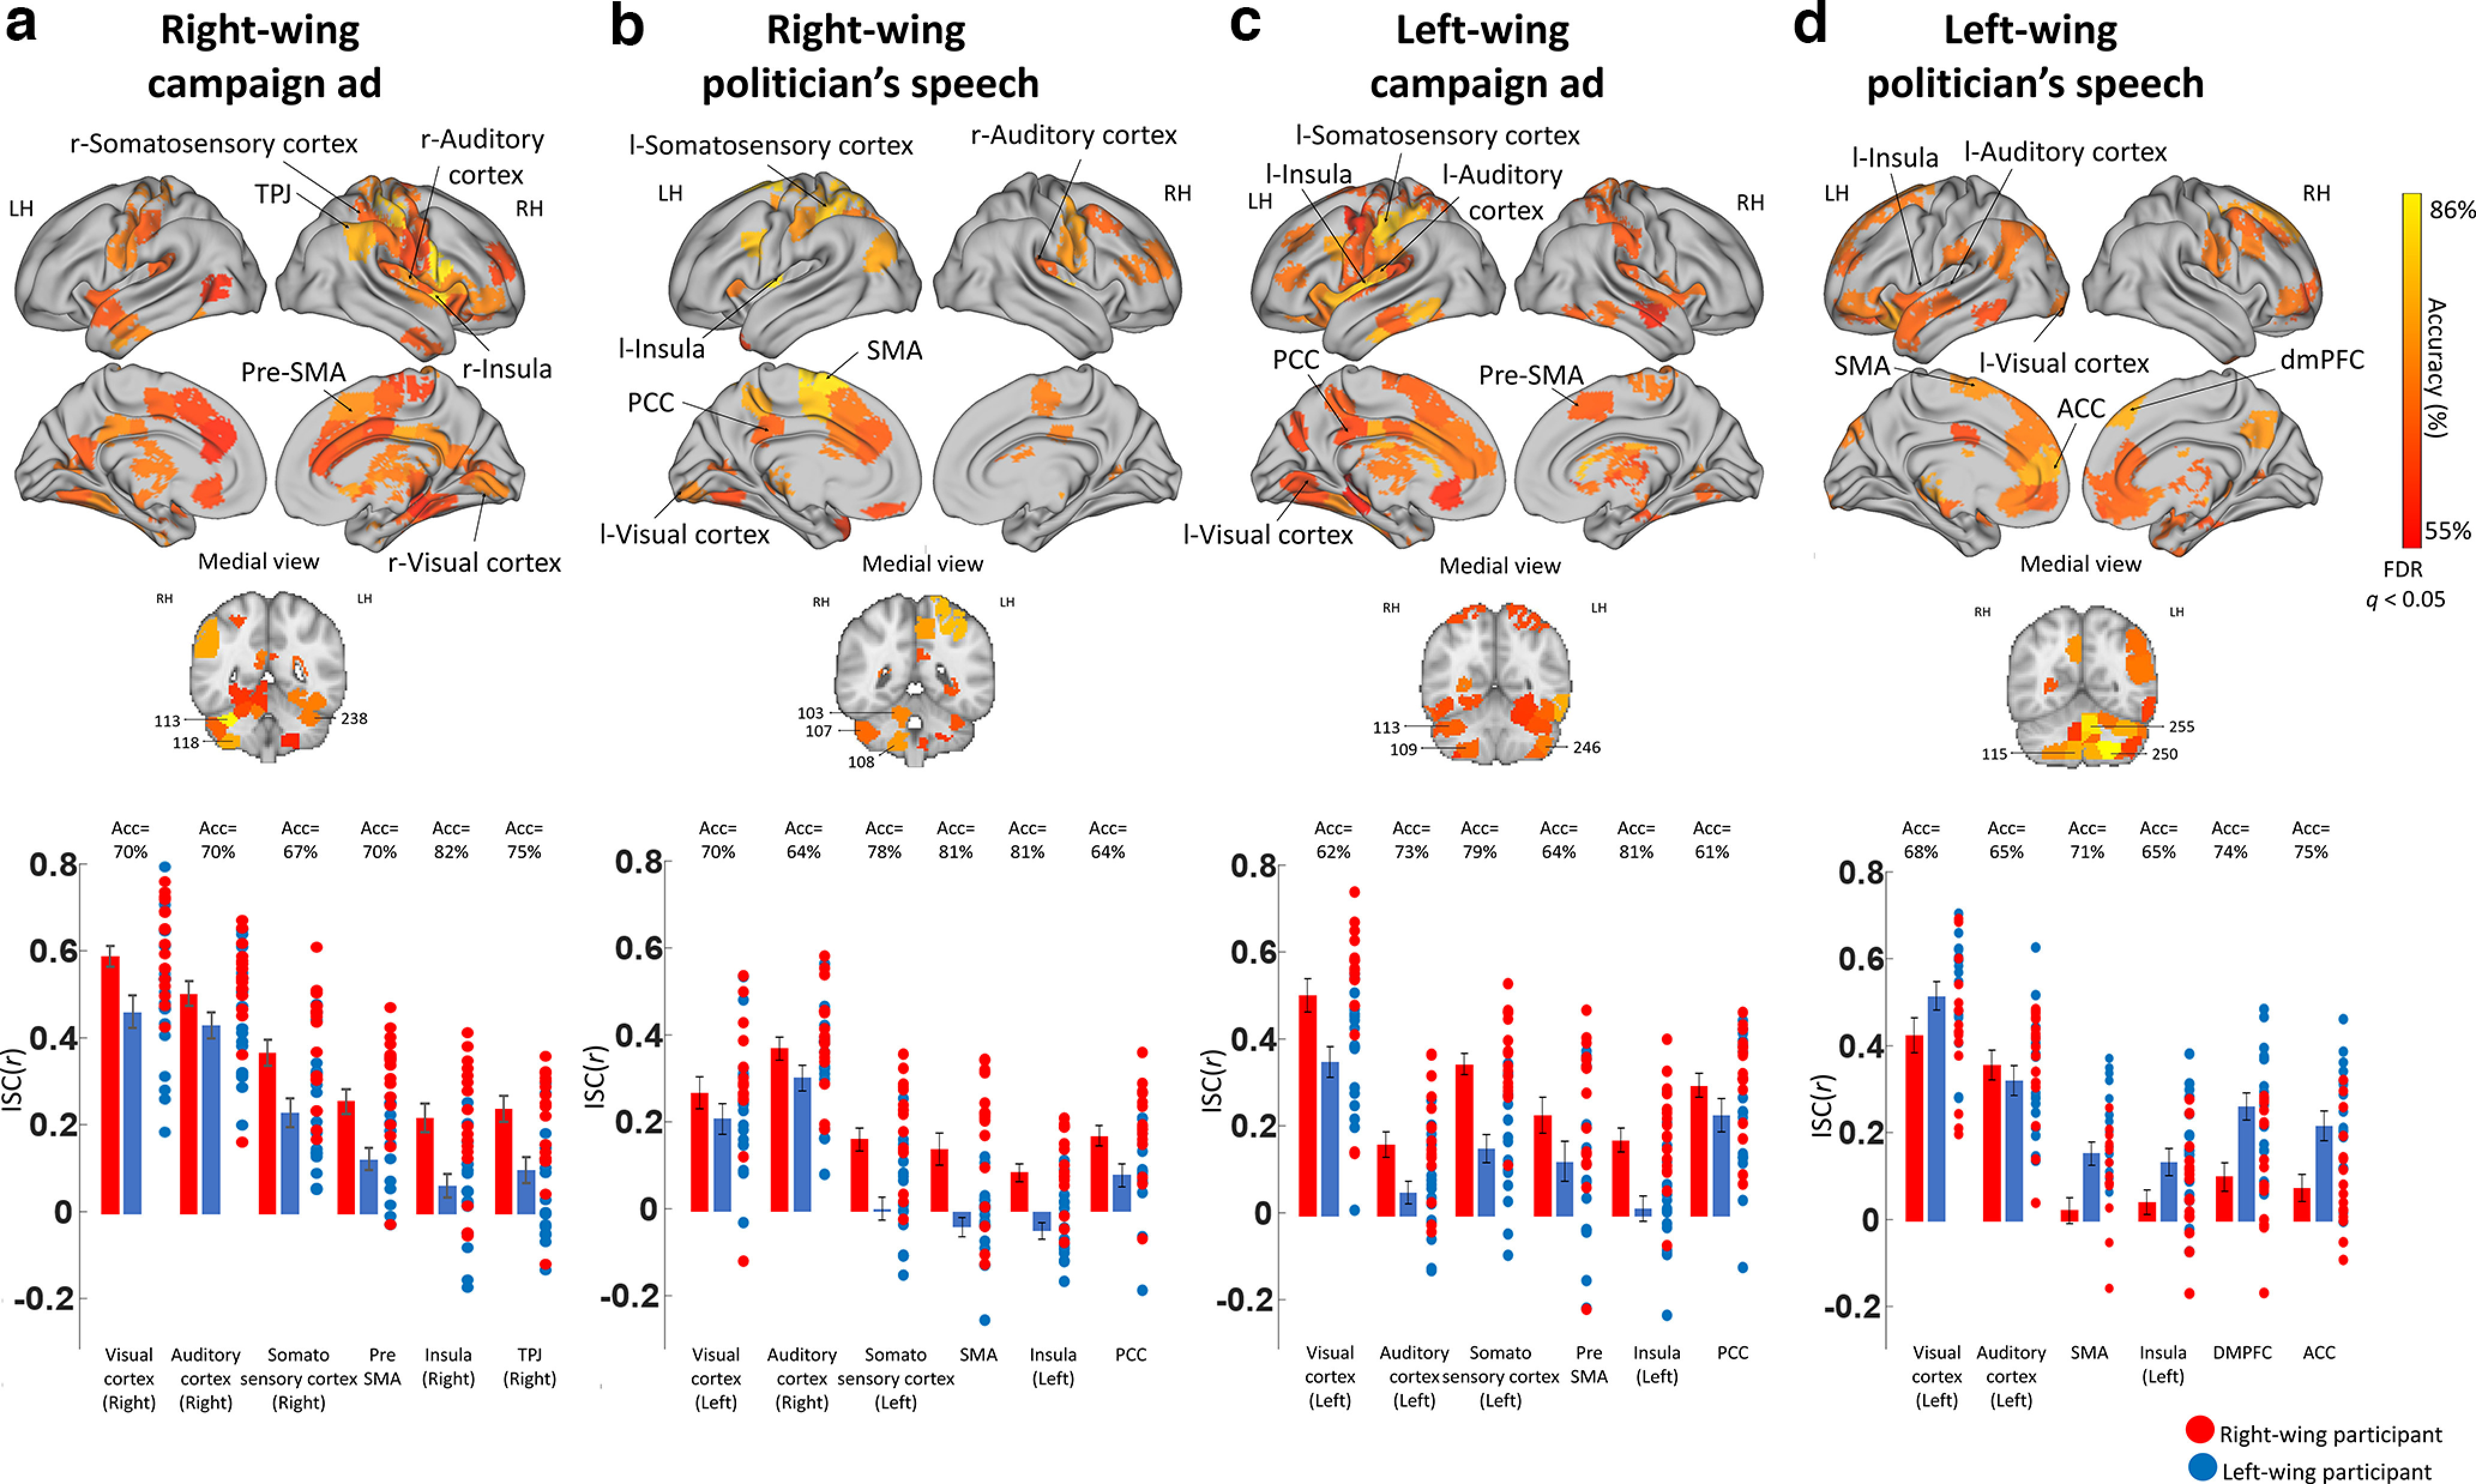
Classifying partisanship based on within-group synchronization. a–d, SVM classifier results for RWC, RWS, LWC, and LWS. Top panels, Brain maps demonstrating regions that significantly classified participant's partisanship according to their within-group synchronization (FDR-corrected, q < 0.05). Bottom graphs, ISC Pearson r values of both groups (mean ± SE), as well as the correlation coefficient of each participant's brain response with the averaged brain response of the rest of their group in six representative brain regions. LH, left hemisphere; RH, right hemisphere.