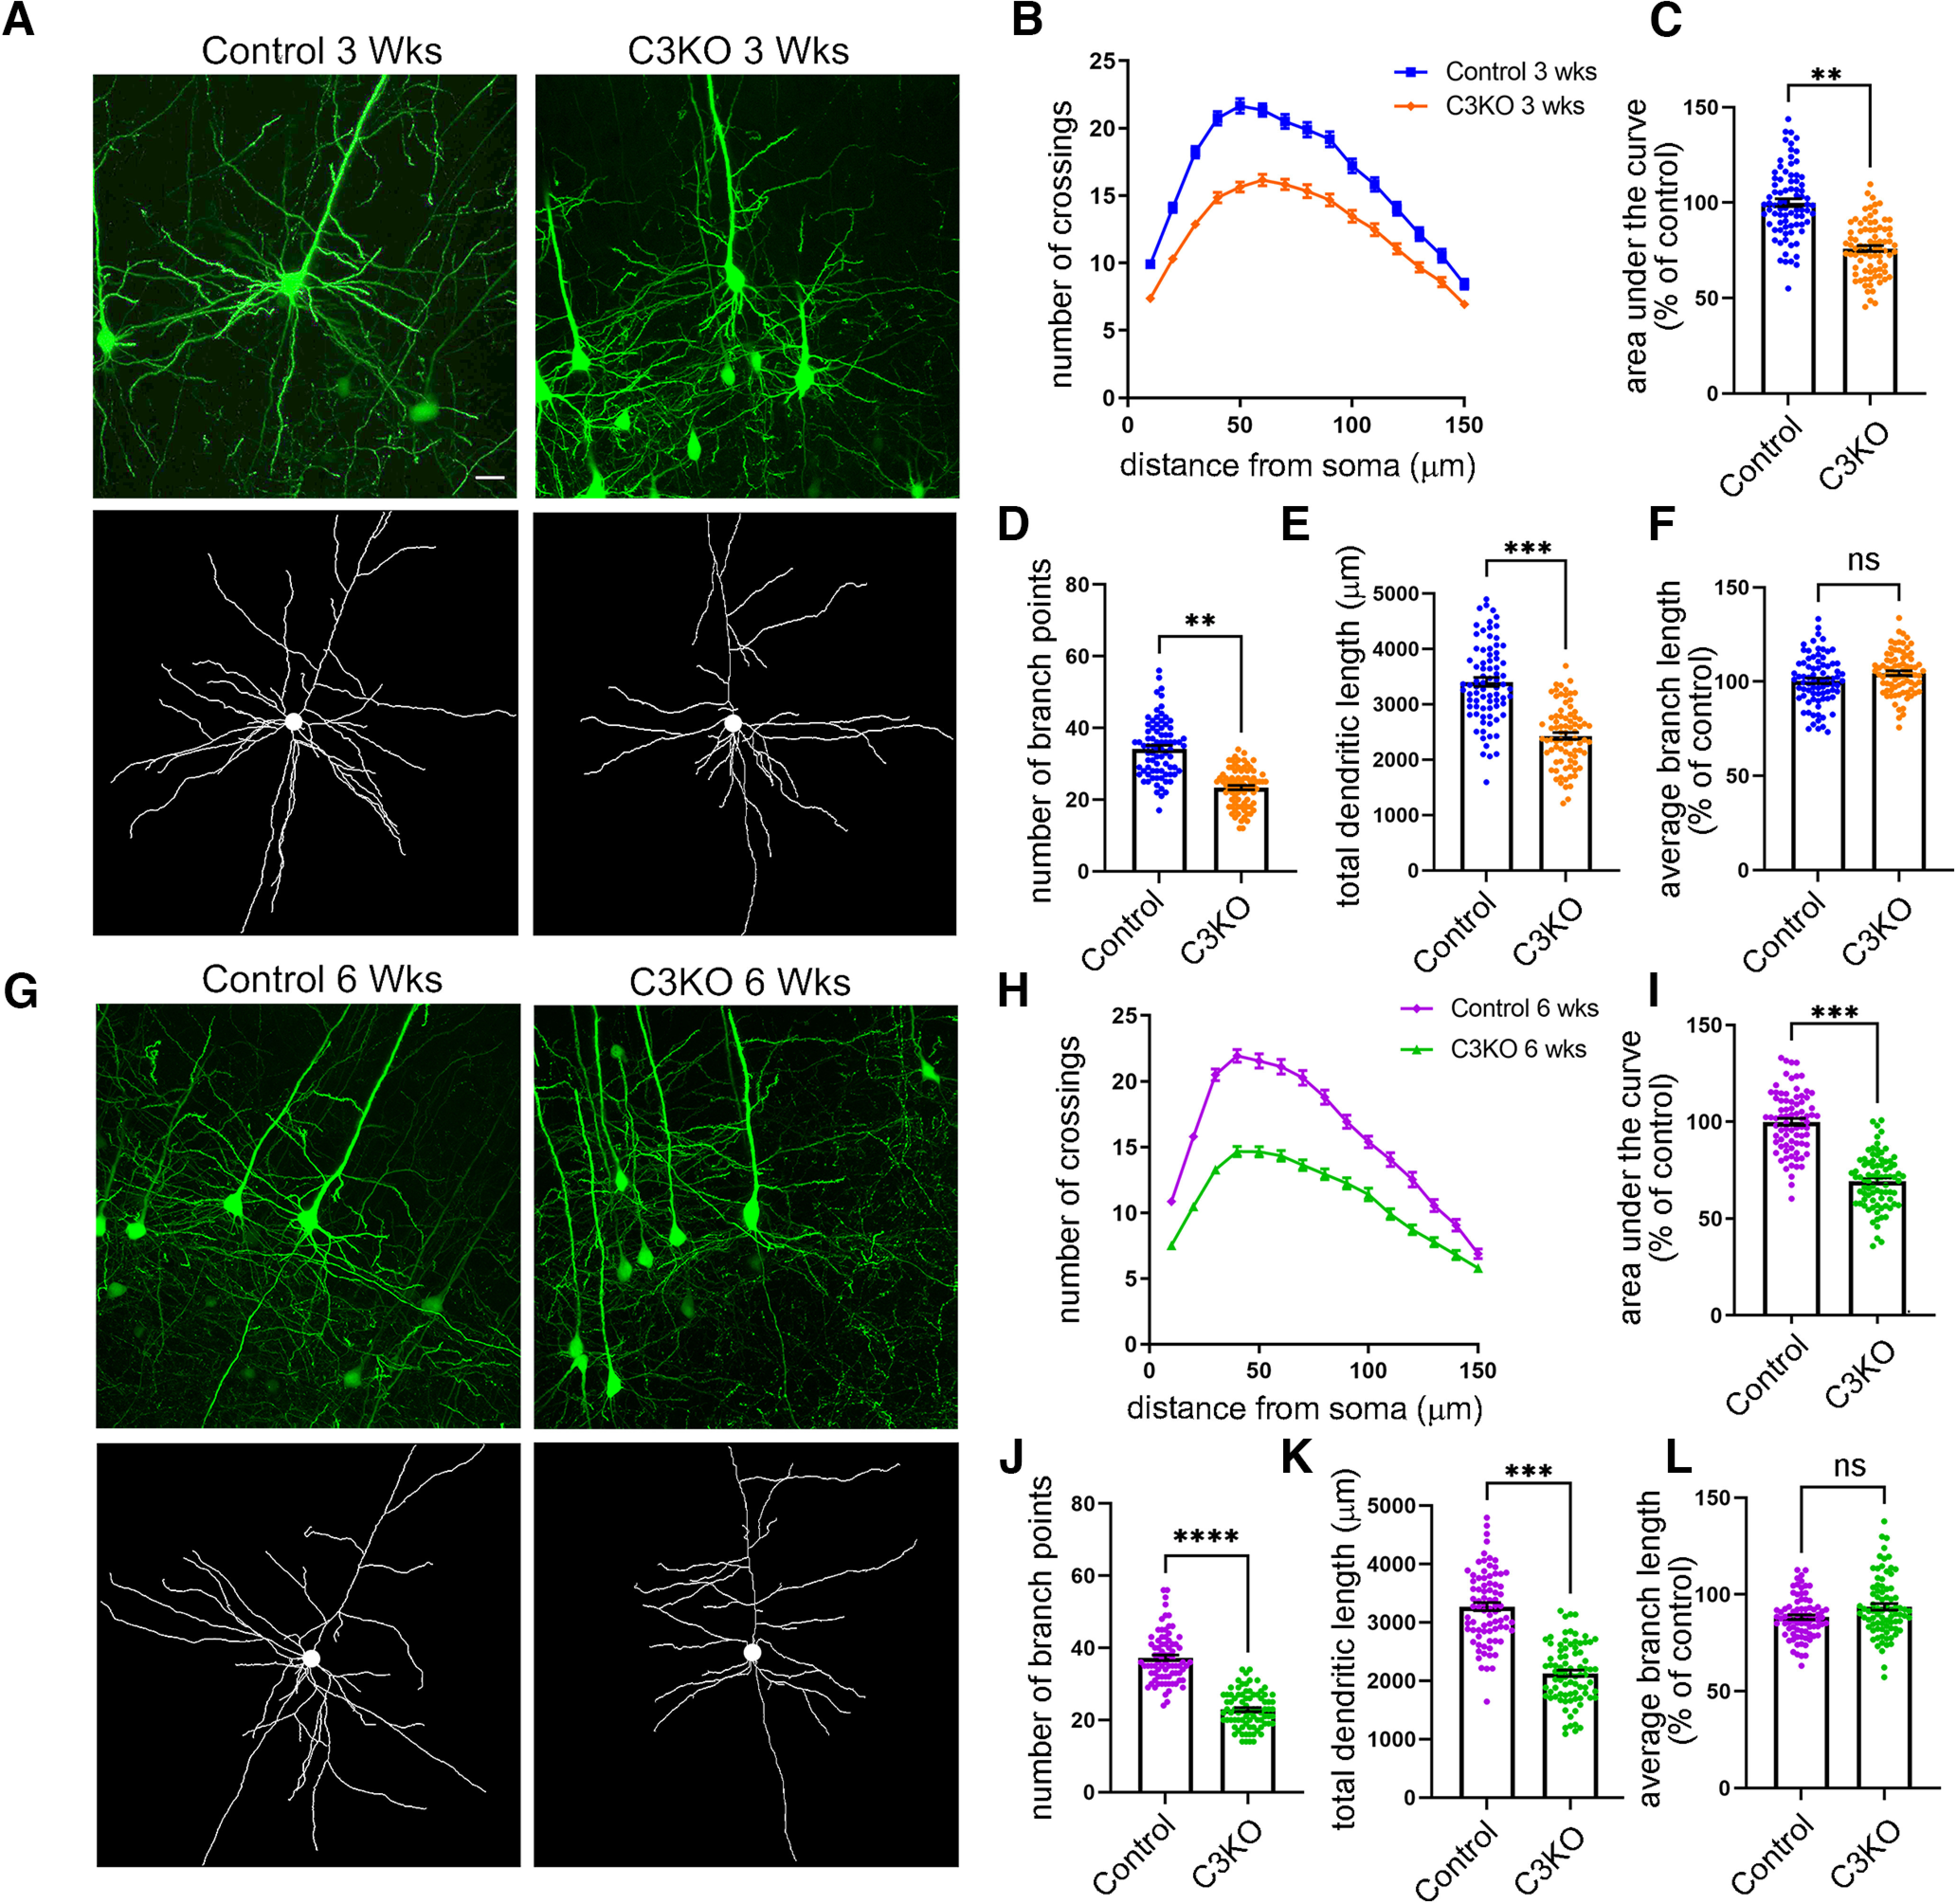
Figure 6.

C3KO mice exhibit decreased dendritic complexity. A, Representative YFP images (top) and tracings (bottom) of Thy1-YFPH-labeled Layer V pyramidal neurons of mice three weeks of age. B, Sholl analysis graphs show dendritic crossings at spheres of increasing 10-µm intervals of mice at three weeks of age. Graphs showing area under the curve of Sholl graphs (C), average number of branch points per neuron (D), total dendritic length (E), and average branch length (F) of mice at three weeks of age. G, Representative YFP images (top) and tracings (bottom) of Thy1-YFPH-labeled Layer V pyramidal neurons of mice six weeks of age. H, Sholl analysis graphs show dendritic crossings at spheres of increasing 10-µm intervals of mice at six weeks of age. Graphs showing area under the curve of Sholl graphs (I), average number of branch points per neuron (J), total dendritic length (K), and average branch length (L) of mice at six weeks of age. Significant reductions in dendritic complexity are seen in C3KO compared with control at both ages. Scale bar: 25 µm. n = ∼80 neurons from at least 4 mice per genotype. Unpaired t test. Error bars represent the SEM; *p < 0.05, **p < 0.01, ***p < 0.001, ****p < 0.0001; ns = not significant.
