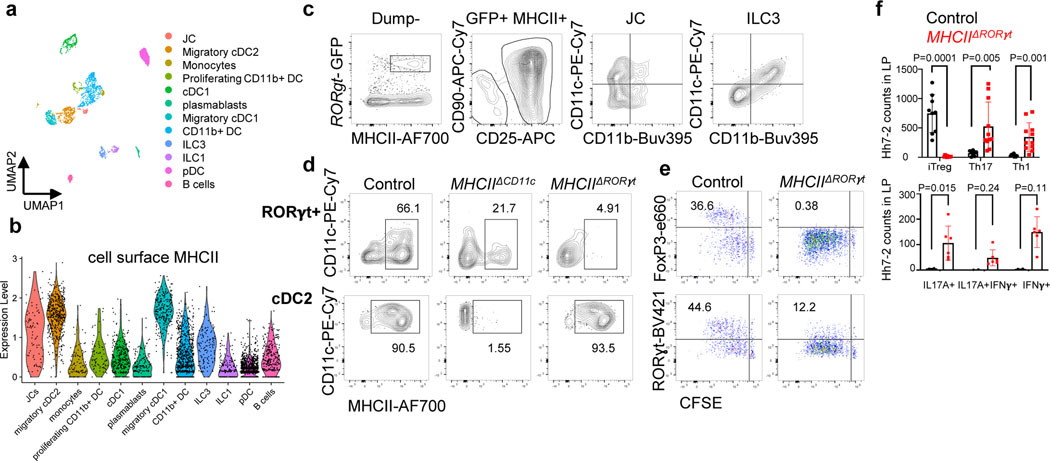
Figure 2. Antigen presentation by RORγt+ cells is required for microbiota-induced iTreg cell differentiation.
a-b, UMAP visualization of the tdTomato-ONCD11c fate-map cell CITE-seq dataset, analyzed by the WNN method (a), and Violin plot showing MHCII protein levels in the different cell clusters (b). MLN cells from Hh-colonized tdTomato-ONCD11c fate-map mice were gated for TCRβ−, TCRγδ−, B220−, and tdTomato+ cells were sorted for CITE-seq analysis. Cells were sorted from two mice and labeled by hashing antibodies (n=2). c, CD11c and CD11b staining of ILC3 and JC from MLN of Hh-colonized RORγt-eGFP mice, gated as indicated. d, MHCII expression in RORγt+ cells (top) and DCs (bottom) from the MLN of Hh-colonized mice of the indicated genotypes. RORγt+ cells were gated as TCRβ−, TCRγδ−, B220−, RORγt+; DC were gated as TCRβ−, TCRγδ−, B220−, CD90−, CD11c+, CD11b+ SIRPα+. e, Hh7–2 cell proliferation and differentiation in MHCIIΔRORγt (n = 6) and I-Abf/f littermate control mice (n = 6) at 3 days after adoptive transfer into Hh-colonized mice. f, Hh7–2 T cell differentiation profiles (upper) and cytokine production (lower) in the large intestine lamina propria at 22 days after transfer into MHCIIΔRORγt (n=11) and littermate controls (n=9). Differentiation was assessed by expression of Foxp3, RORγt with or without T-bet, and T-bet. Data summarize two independent experiments. All statistics were calculated by unpaired two-sided Welch’s t-test. Error bars denote mean ± s.d. p-values are indicated on the figure.

