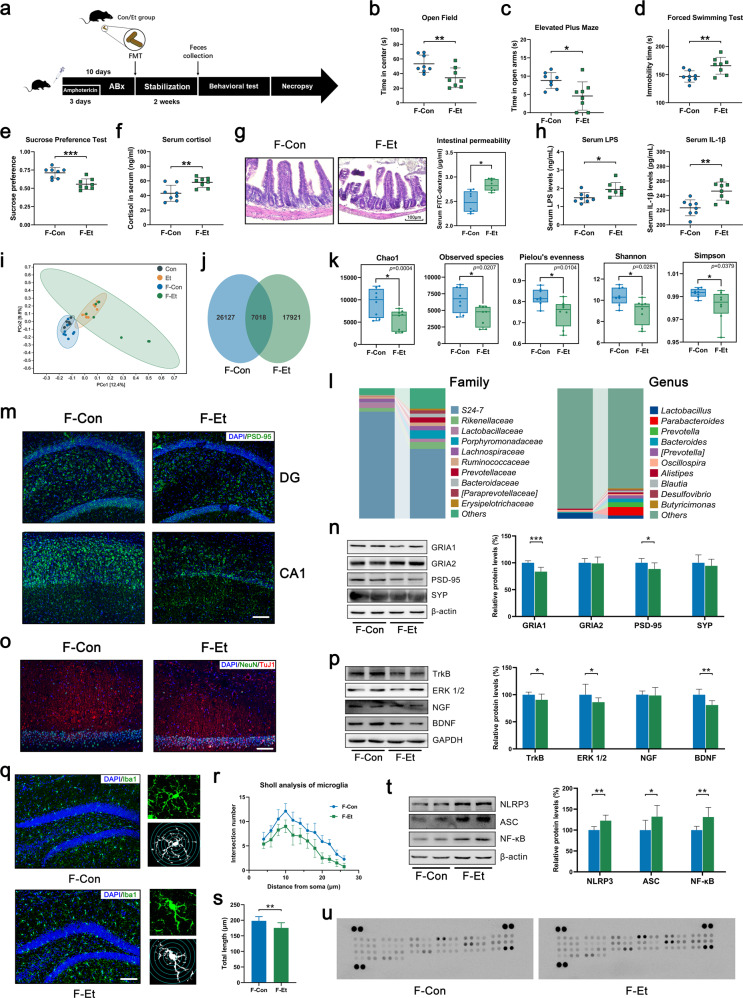
Fig. 2. FMT from CEE-exposed mice induced depressive-like behavior and hippocampal neuroinflammation in recipient mice.
a Experimental design of FMT. b Time in the central area of the OFT. c Time spent in the open arms of the EPM. d Immobility time in the FST. e Immobility time in the TST. f Cortisol concentration in mouse serum. g Representative photomicrographs of ileum tissue and intestinal permeability (scale bar = 100 μm). h Serum LPS and IL-1β concentrations. i PCoA plot showing unweighted UniFrac distances between donor mice and recipient mice. j Venn diagram of the OTUs detected in the recipient mice. k Difference in α-diversity among recipient mice. l Barplots showing the relative abundance of the gut microbiota at the family and genus levels. m, n IF and Western blot showing that FMT from CEE-exposed mice reduced the expression of synaptic proteins in the hippocampus (scale bar = 100 μm). o IF of NeuN and TuJ1 showing the state of neurons in the hippocampal CA1 area (scale bar = 100 μm). p Western blot showing that FMT from CEE-exposed mice reduced the expression of neurotrophic proteins in the hippocampus. q–s IF of Iba1 and Sholl analysis showing the number, morphology, and length of microglia in the hippocampus (scale bar = 100 μm). t FMT from CEE-exposed mice reduced the expression of NLRP3, ASC and NF-κB in the hippocampus. u Mouse cytokine array showed an increase in 18 inflammatory factors or chemokines in the hippocampus after FMT from CEE-exposed mice (the legend is shown in Fig. S7). Data are expressed as the mean ± SD, n = 8. *p < 0.05, **p < 0.01, ***p < 0.001.

