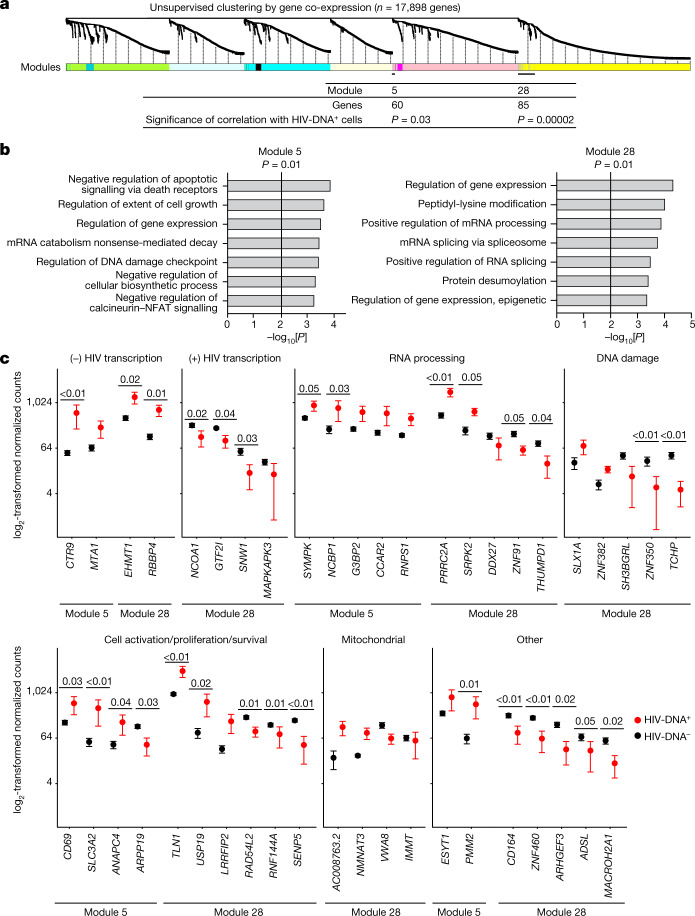
Fig. 3. Co-expressed gene signatures in HIV-DNA+ memory CD4 T cells under ART.
a, The 17,898 genes detected in ≥2 samples from the curated dataset were processed for WGCNA as described in the Methods. A total of 28 resulting modules of genes defined by distinct co-expression patterns across the samples are indicated as coloured segments, with the relatedness among genes indicated by the dendrogram. The two modules that were significantly correlated with the HIV DNA status of the samples are indicated at bottom (module 5, 60 genes, R = 0.46, P = 0.03; module 28, 85 genes, R = 0.78, P = 2 × 10⁻⁵; weighted Pearson correlation). b, Gene ontology (GO) analysis of module 5 and module 28 gene lists. All significant terms (adjusted P ≤ 0.05, Fisher’s exact test, Benjamini–Hochberg multiple-testing correction) are shown, except for redundant terms that are shown in Supplementary Table 6, but were omitted here for clarity. c, Genes from modules 5 and 28 with normalized expression levels that differed by an average of at least twofold between HIV-DNA+ and HIV-DNA− cells and had a concordant direction of difference in all of the participants. Genes are grouped in individual plots according to putative biological function. P values calculated using Wald tests are shown for genes with P < 0.05 in the differential expression analysis between HIV-DNA+ and HIV-DNA− cells. n = 16 biologically independent HIV-DNA− and 6 biologically independent HIV-DNA+ samples sorted separately from 3 participants. Data are mean ± s.e.m.

