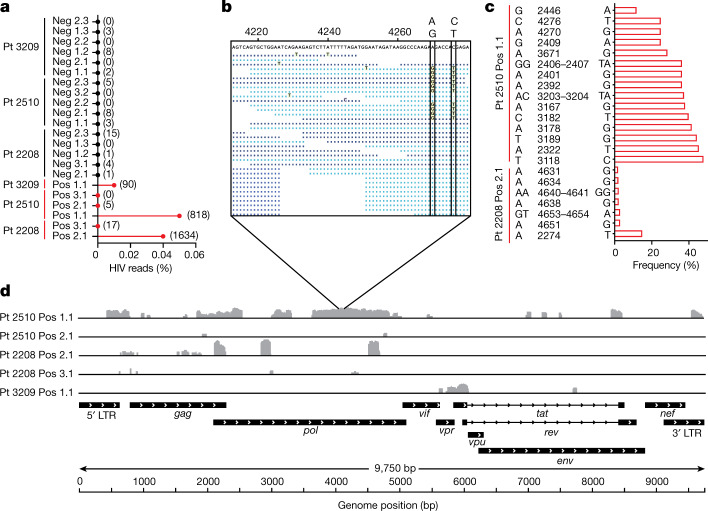
Fig. 4. HIV RNA sequences in memory CD4 T cells under ART.
a, The percentages of all exonic reads mapping to a clade B HIV reference genome for all samples. Absolute read counts are shown in parentheses. HIV-DNA− samples are shown in black, and HIV-DNA+ samples are shown in red. b, Expanded view of coverage for sample 2510 Pos 1.1, with the vertical boxes indicating two linked variant positions within the given region. Reads shown in light blue and dark blue are those mapped in the forward and reverse orientations. Nucleotide bases that match the sample consensus at the top are shown as dots. c, Graphical representation of HIV reference genome base positions at which variation was detected among sequence reads, as described in the Methods. Samples with no detectable variation are not shown. d, The coverage of mapped reads across the HIV reference genome for HIV-DNA+ cells. Individual samples are labelled with the participant ID number, followed by the HIV DNA status (HIV-DNA+ (pos) and HIV-DNA− (neg)), and then an identifier denoting the replicate number. Sample 2510 Pos 3.1 is omitted from this panel owing to a lack of HIV reads in that sample.

